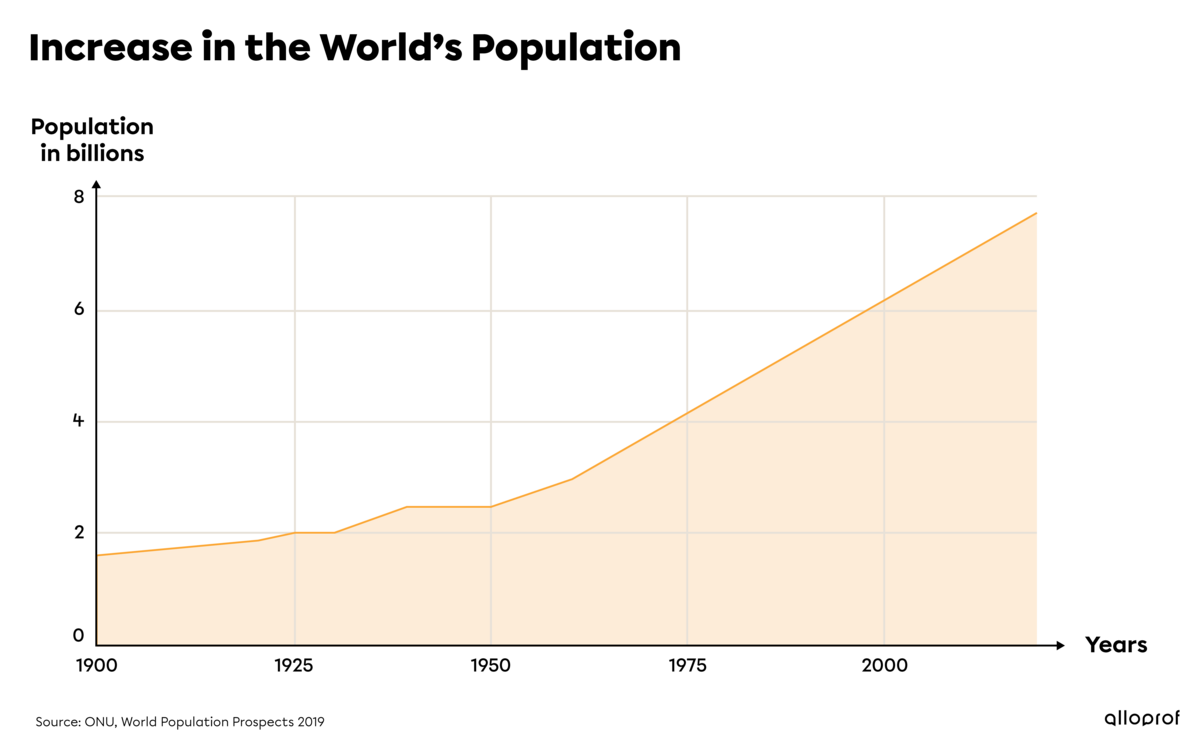
The global population has been increasing rapidly since the 19th century, in large part because the mortality rate has fallen significantly as a result of the following factors:
-
better hygiene
-
better food
-
advancements in medicine
-
fewer epidemics
The mortality rate is the number of deaths per 1000 inhabitants in a given population in one year.
Since the early 20th century, life expectancy has also been increasing. According to United Nations (UN) data, the world’s population has grown from 1 billion in 1804 to 7 billion in 2011. This is a huge population increase.
Below are few key concepts to better understand demographic changes:
-
fertility
-
birth rate
-
mortality
-
life expectancy
-
migration
-
natural increase
-
total growth
The fertility rate indicates the average number of births per woman in a country for a given period. The graph below shows how this rate changed in Canada from 1960 to 2017.
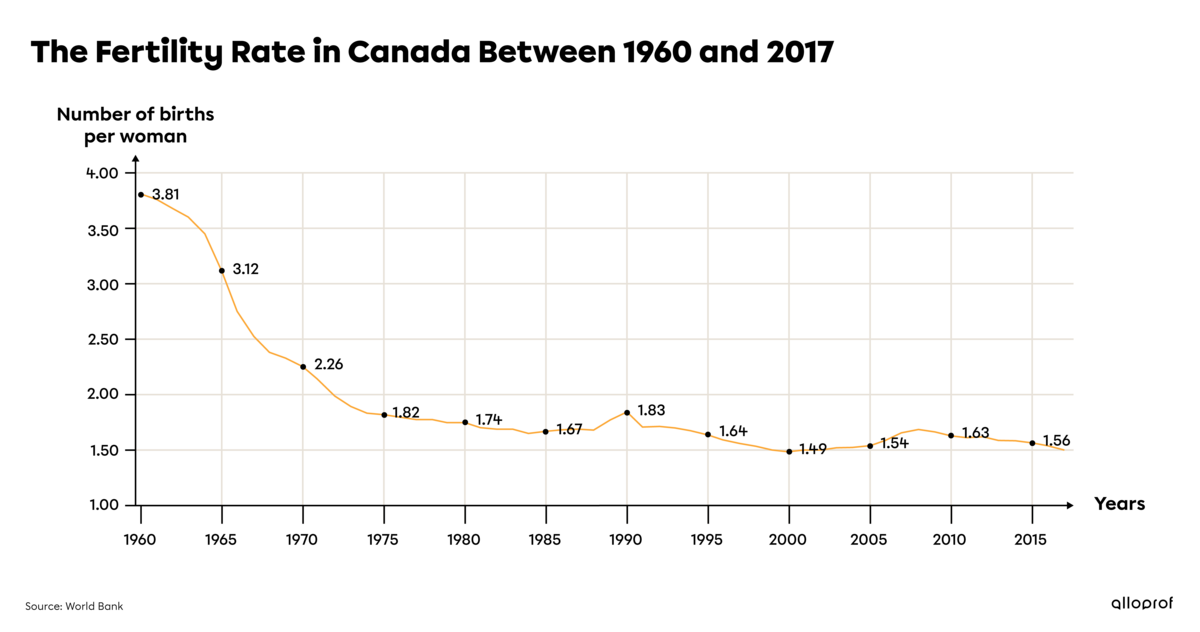
In Canada, this rate fell from 3.81 births per woman in 1960 to 1.50 children in 2017. Better access to birth control and abortion as well as the growing presence of women in the workforce explain this significant drop in fertility.
The birth rate is the number of births in a country in a given year. It is calculated based on the average number of births per 1000 inhabitants. The graph below shows how this rate changed in Canada between 1960 and 2017.
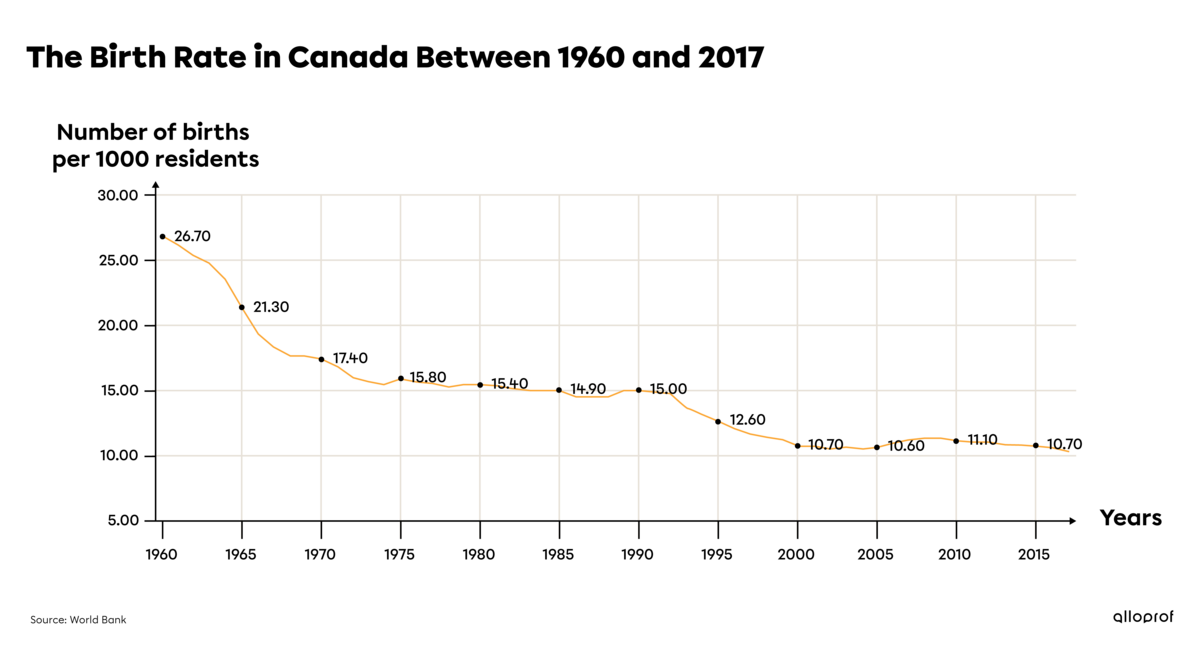
In Canada, this rate fell from 26.70 births per 1000 inhabitants in 1960 to 10.3 births per 1000 residents in 2017. Like the fertility rate, the reasons for this significant decline include better access to birth control and abortion and the growing presence of women in the workforce.
The mortality rate is the number of deaths per 1000 residents. The graph below shows how the mortality rate in Canada changed from 1960 to 2017.
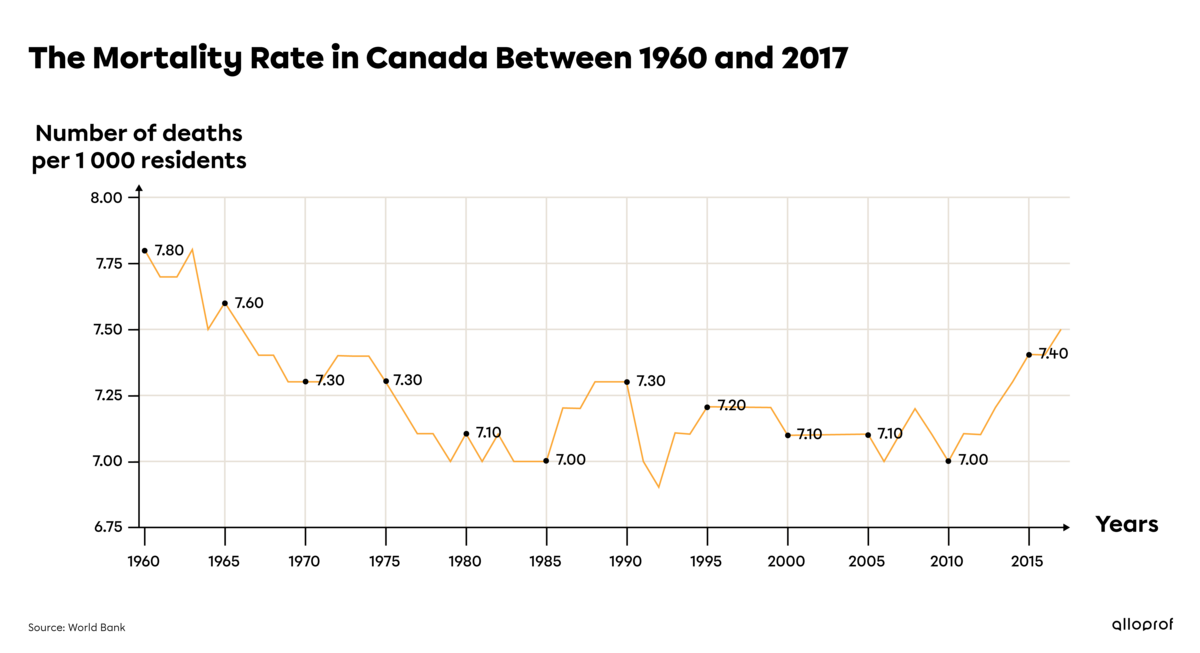
The mortality rate varied considerably between 1960 and 2017 in Canada. The highest recorded mortality rate was 7.8 deaths per 1000 inhabitants between 1960 and 1963, while the lowest was 6.9 deaths per 1000 inhabitants in 1992. In recent years, this rate has increased from 7.10 deaths per 1000 inhabitants in 2012 to 7.50 deaths per 1000 inhabitants in 2017.
Life expectancy measures the number of years a person living in a certain country can expect to live. It varies greatly depending on the country’s health and social conditions. The graph below shows the evolution of life expectancy in Canada from 1960 to 2017.
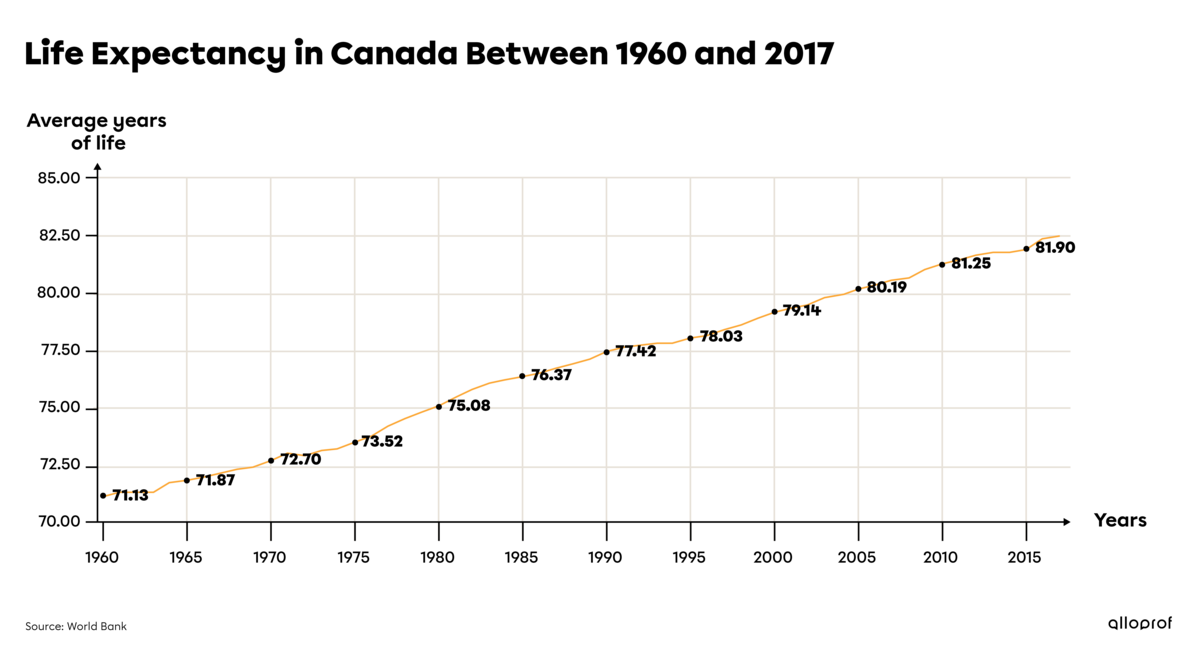
In Canada, life expectancy has increased from 71.13 years in 1960 to 82.47 years in 2017. One of the main reasons for this increase in life expectancy is medical advancements. Over the same period, life expectancy in Haiti, a developing country, increased from 42.11 years in 1960 to 63.58 years in 2017. This is a similar increase to Canada, despite the lower life expectancy.
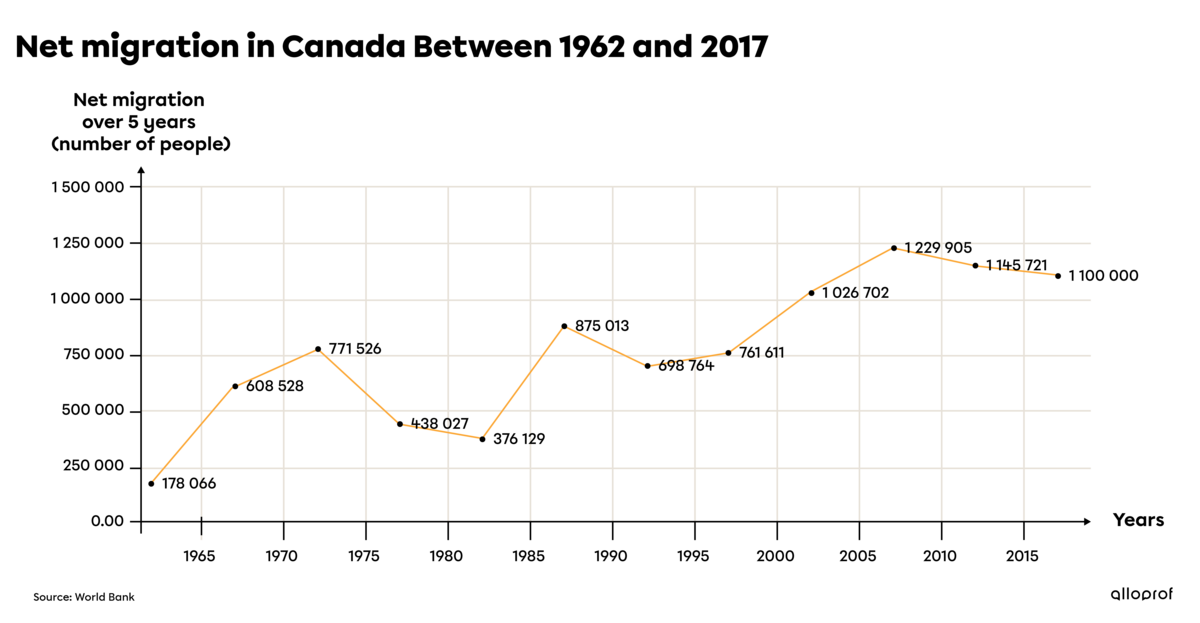
Migration is the movement of people from one place to another. Net migration is the number of immigrants (people entering a country) minus the number of emigrants (people leaving a country).
Number of immigrants - Number of emigrants = Net migration
The migration balance is often expressed as net migration, but calculated over a five-year period. In 1962, net migration to Canada was 178 066 people. In 2017, it was 1 100 000 people. The graph below shows how net migration changed in Canada from 1962 to 2017.
Natural increase is the difference between the number of births and the number of deaths over a given period. This increase is positive if the number of births exceeds the number of deaths (mortalities).
Number of births - Number of deaths = Natural increase
This increase is negative if the number of deaths exceeds the number of births. This occurs when the fertility rate is below 2.1 children per woman. It takes 2.1 children per woman to keep the population constant. This is called replacement level fertility.
|
Birth, death and fertility rates of certain countries in 2017 |
||||
|---|---|---|---|---|
|
|
Birth rate (per 1000 inhabitants) |
Mortality rate (per 1000 inhabitants) |
Fertility rate |
Overall finding for the continent |
|
North and South America |
Although there are more births than deaths, the fertility rate is not high enough to ensure population replacement. |
|||
|
Brazil |
13.92 |
6.24 |
1.71 |
|
|
Canada |
10.30 |
7.50 |
1.50 |
|
|
Africa |
This is by far the fastest-growing continent. Women have six children on average, but the mortality rate is very high. |
|||
|
Nigeria |
38.40 |
12.16 |
5.46 |
|
|
Chad |
42.80 |
12.71 |
5.85 |
|
|
Asia |
More industrialized countries have lower fertility rates than less industrialized ones. Some countries, such as Japan, have very little immigration, which contributes to population decline. |
|||
|
China |
12.43 |
7.11 |
1.63 |
|
|
India |
18.78 |
7.33 |
2.30 |
|
|
Japan |
7.60 |
10.80 |
1.43 |
|
|
Syria |
20.91 |
5.37 |
2.87 |
|
|
Europe |
Europe is highly industrialized, which means that the number of births is lower than the number of deaths, but the population is still growing due to high immigration. |
|||
|
France |
11.40 |
9.00 |
1.92 |
|
|
Italy |
7.60 |
10.0 |
1.34 |
|
|
Portugal |
8.40 |
10.60 |
1.36 |
|
Countries with fertility rates below the replacement level of 2.1 children per woman often rely on immigration to offset their negative natural increase.
Migratory increase and net migration are the same thing. This is the number of immigrants (people entering a country) minus the number of emigrants (people leaving a country) in a given country in a given year. For example, if Chile has 1000 immigrants and 500 emigrants in 2020, the migratory growth would be 500. If there are more emigrants than immigrants, the growth is negative.
The total growth is the combination of natural increase and net migration, or in other words migratory increase. Factors that lead to total population growth are births and immigrants, and factors that cause the population to decrease are deaths and emigrants.
(birth - death) + (immigration - emigration)
Natural increase Migratory increase = Total growth
Population growth is generally due to the adoption of pro-birth policies, such as financial support for families, and measures that promote immigration. To have positive total growth, governments must promote births and immigration. Better health care also plays a significant role in population growth.
Between July 1, 2017, and July 1, 2018, the migratory increase was 412 747 people. This means there were 412 747 more immigrants (people entering the country) than emigrants (people leaving the country).
The natural increase was 105 841 people, with 385 777 births and 279 936 deaths.
On July 1, 2018, Canada’s estimated population was 37 058 856, an increase of 518 588 from July 1, 2017. This is a population growth rate of 1.4%. Let’s take a closer look at these calculations.
Immigration - Emigration = Migratory increase (412 747)
Births - Deaths = Natural increase (105 841)
Migratory increase (412 747) + Natural increase (105 841) = Total growth (518 588)
A developing country is less industrialized and the standard of living for people is often low.
-
declining mortality rate
-
declining fertility rate
-
more births than deaths
-
population growth
-
higher life expectancy
-
rising international migration
Below are a few explanations. Life expectancy is increasing due to decreasing poverty and advances in medicine and hygiene, as well as better access to essential resources such as clean water and food. In addition, international migration occurs in both developed and developing countries.
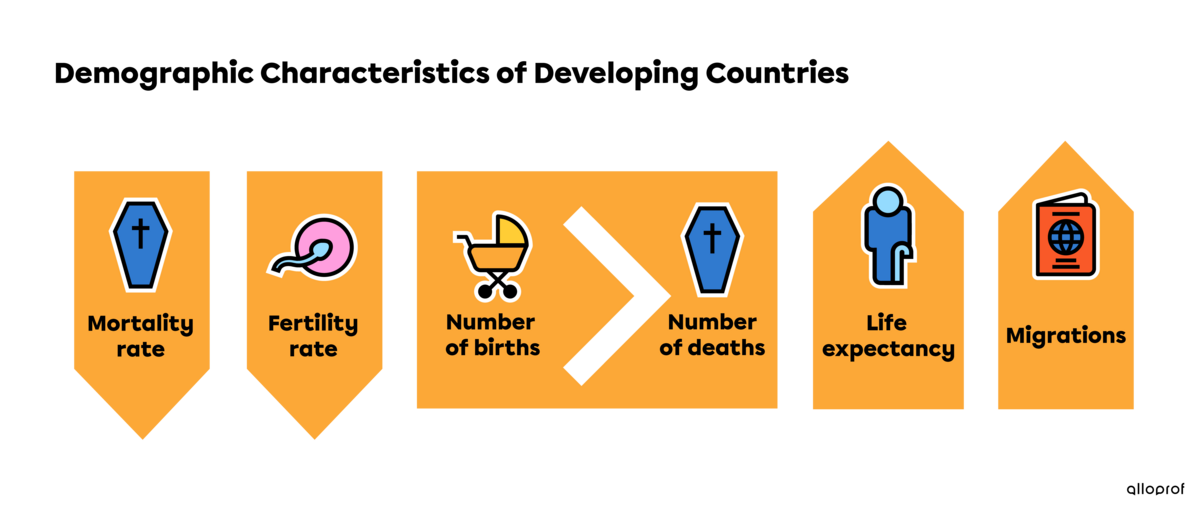
Let’s use Mali as an example of a developing country.
-
The mortality rate decreased from 36.84 deaths per 1000 inhabitants in 1960 to 9.8 deaths per 1000 inhabitants in 2017.
-
The number of births per woman rose from 6.97 children in 1960 to 7.16 in 1991. Then it dropped to 5.97 children per woman in 2017.
-
In 2018, the annual growth rate was 3.01%.
-
Life expectancy increased from 28.20 years in 1960 to 58.46 years in 2017.
-
In 2012, net migration over five years was negative, meaning there were 302 449 fewer people than five years earlier.
A developed country is an industrialized country whose economy includes many high-tech industries and where the people enjoy a generally high standard of living.
-
declining birth rate
-
declining fertility rate
-
aging population
-
adoption of policies to encourage births
-
immigration to make up for the falling birth rate
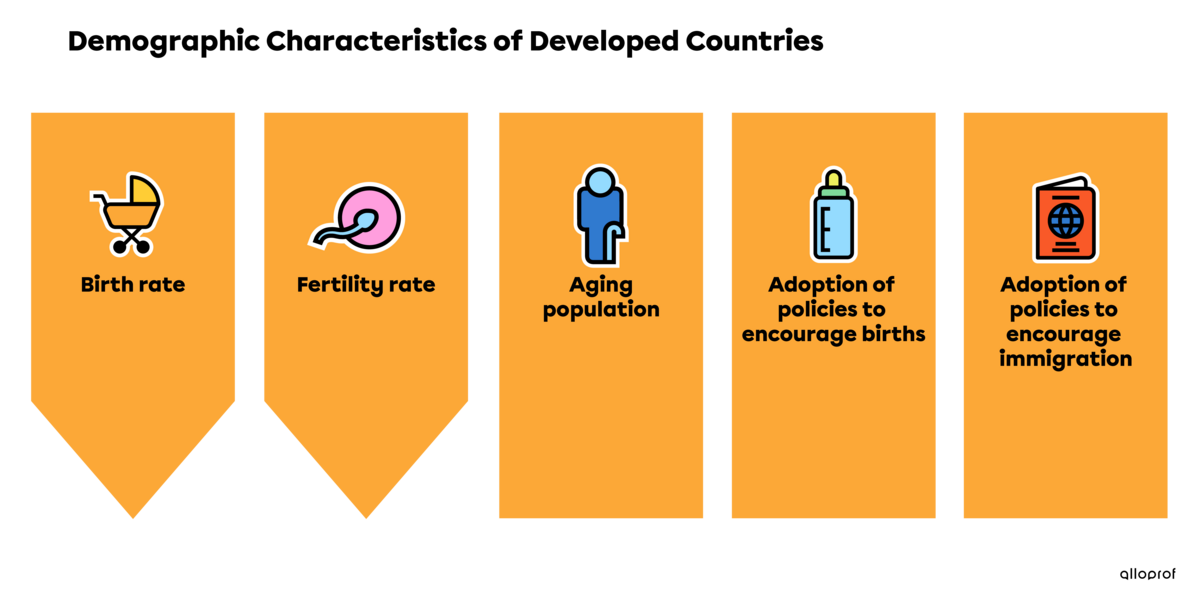
Let’s use the developed country of France as an example.
-
The birth rate fell from 18.70 births per 1000 inhabitants in 1960 to 11.40 births per 1000 inhabitants in 2017.
-
In the same period, the fertility rate fell from 2.85 births per woman to 1.92 births.
-
The country has an aging population.
-
The percentage of people aged 65 and over rose from 16.2% in 2003 to 19.7% in 2018.
-
Life expectancy at birth was 82.52 years in 2017.
-
Net migration over five years was 400 002 people in 2017.
Brodeur-Girard, Sébastien et collab. Immédiat, 2009.
Ladouceur, Maude and collab. Globe, 2014.