Economic indicators allow us to assess and compare the wealth of countries. These indicators include:
Gross domestic product (GDP) is used to calculate a country’s wealth by measuring the total value of all goods and services produced within that country over a given period (usually 1 year).
To get more accurate data with the Gross Domestic Product (GDP), inflation and changes in the value of currencies around the world must be taken into account.
To reduce the effects of inflation, the GDP is calculated in constant dollars, i.e. taking the value of a currency in a specific year and using this as the reference value to calculate the GDP.
To reduce the effects of fluctuations on the value of currencies around the world, the GDP needs to be converted into a common unit of measurement to reflect the purchasing power parity (PPP). All GDPs are calculated based on the same attributes so they can be compared.
-
Inflation is the general and continuous increase in the price of goods.
-
Purchasing power parity (PPP) is a way of converting the different currencies around the world into a common currency to compare the purchasing power of each currency.
The GDP per capita takes into account the size of a country’s population when calculating its wealth. The GDP is divided by the number of people living in the country. In theory, the higher the amount per capita, the more the country can spend on each inhabitant. This means countries with a higher GDP are richer.
In 2018, Canada’s GDP was almost $1 807.9 billion (in constant dollars and PPP). In the same year, the United States had a GDP of almost $20 055.8 billion (Perspective Monde, n.d.-c). When comparing the two GDP, the USA’s GDP was almost 11.1 times higher than that of Canada.
However, if we look at the GDP per capita, in constant dollars and taking into account PPP, the gap between the two countries’ economies is very different. The USA’s GDP per capita is only 1.26 times higher than Canada’s ($61 391 for the United States and $48 787 for Canada) (Perspective Monde, n.d.-b). This is because the United States has a larger population than Canada. While the USA GDP is much higher than Canada’s GDP, it is divided by a larger number of people. Its GDP per capita is still higher than Canada’s, but the gap between the two countries is much smaller.
Unemployment refers to a period of time when a person is without work, but is able to work and is actively seeking employment.
The unemployment rate is the number or proportion of unemployed people. It is calculated by performing the following operation:
|\dfrac{\text{Unemployment rate}}{\text{Labour force}}\times 100=\text{Unemployment rate}|
In this equation, the active population includes all individuals over 15 years of age who are working or looking for work.
The active population, also called labour force, is the total number of people of working age (15 to 64) who have a job or are looking for a job.
Healthy economies are generally associated with a lower unemployment rate, since all people of working age who want to work are able to find a job and earn an income.
Canada’s unemployment rate fluctuated several times between 1976 and 2006. It was at its lowest in 2007, at a rate of 5.2%, and at its highest in 1983, at a rate of 11.6% (Statistics Canada, 2017).
To find out more, see the concept sheet on Unemployment.
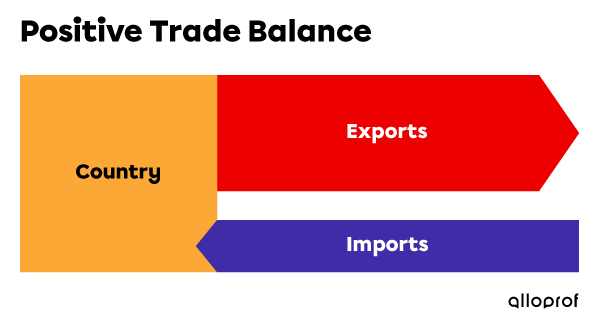
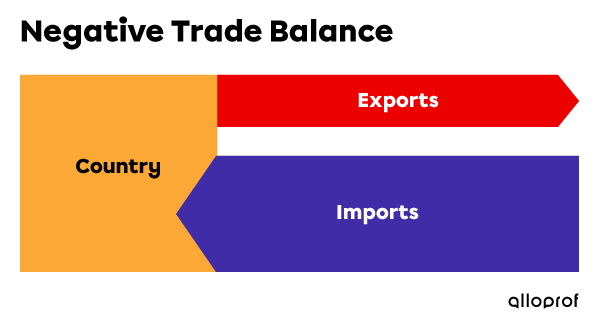
The trade balance is the difference between a country’s exports and imports.
A trade balance is positive when exports are higher than imports. In this case, a country sells more goods abroad than it buys.

On the other hand, when a country imports more goods than it exports, it has a negative trade balance.

A positive or negative trade balance can indicate the health of a country’s businesses and industries. A positive trade balance is preferable since it means that the country has sold more than it has bought from foreign countries, making a profit that contributes to the country’s economy.
China’s trade balance has been positive for more than 20 years. In 2018, the value of its trade balance was approximately US$106.6 billion (Perspective Monde, n.d.-a).
In the last 20 years, Canada’s trade balance has gone from positive to negative. In 2018, the value of Canada’s trade balance was approximately -US$33.6 million . (Perspective Monde, n.d.-a)
The trade balance is only one of the indicators for assessing a country’s economy. Several indicators should be used to assess an economy’s health.
Perspective Monde (n.d.-a). Balance commerciale ($ US courant), Chine, Canada. http://perspective.usherbrooke.ca/bilan/servlet/BMTendanceStatPays?codeTheme=7&codeStat=NE.RSB.GNFS.CD&codePays=CHN&optionsPeriodes=Aucune&codeTheme2=7&codeStat2=NE.RSB.GNFS.CD&codePays2=CAN&optionsDetPeriodes=avecNomP
Perspective Monde (n.d.-b). PIB par habitant (Parité pouvoir d'achat) ($ international constant 2011), Canada, États-Unis.
https://perspective.usherbrooke.ca/bilan/servlet/BMTendanceStatPays?codeTheme=2&codeStat=NY.GDP.PCAP.PP.KD&codePays=CAN&optionsPeriodes=peReEco&codeTheme2=2&codeStat2=NY.GDP.PCAP.PP.KD&codePays2=USA&optionsDetPeriodes=avecNomP
Perspective Monde (n.d.-c). PIB (Parité pouvoir d'achat) ($ international constant), Canada, États-Unis. https://perspective.usherbrooke.ca/bilan/servlet/BMTendanceStatPays?codeTheme=2&codeStat=NY.GDP.MKTP.PP.CD&codePays=CAN&optionsPeriodes=peReEco&codeTheme2=2&codeStat2=NY.GDP.MKTP.PP.CD&codePays2=USA&optionsDetPeriodes=avecNomP
Statistics Canada. (2017, July 7). Graphique 3. Les taux de chômage au Canada et aux États-Unis, 1976 à 2016. https://www150.statcan.gc.ca/n1/daily-quotidien/170707/cg-a003-fra.htm