Disparity is inequality between two things.
Each country has a different economic situation. Some countries have access to resources that others lack. Depending on a country’s resources and infrastructure, it will focus on specific economic areas, such as mining, fishing, farming, services, advanced technologies or manufacturing. This means that some countries have more wealth than others.
How can these differences be identified and measured? What tools are used to compare countries?
As mentioned in the concept sheet on wealth creation, the exploitation of natural resources is one factor that influences a country’s wealth creation. These resources can be the backbone of a country’s economy, since their extraction, processing and sale are three major sources of income.
There are several different types of natural resources:
-
mined minerals, such as copper, iron and coltan
-
fossil fuels, such as oil, natural gas and coal
-
wood from forests
-
fresh water
-
fertile land for farming
Not all countries have the same natural resources. Some have more resources than others, because of either the size or composition of their land (forests, rivers, deserts, etc.). Some countries are unable to exploit their available resources, due to a lack of infrastructure, capital or skilled labour. This leads to a disparity between countries, as some get rich more easily.
Disparity is inequality between two things.
 |
Saudi Arabia and Venezuela have large oil reserves, which they exploit. Since oil is in high demand around the world, these countries generate much of their wealth from the oil trade. |
 |
A number of African countries are sitting on deposits of metals and minerals, including iron, copper and diamonds. The Democratic Republic of the Congo has an abundance of minerals, such as cobalt, copper and coltan. The same is true for certain South American countries: Chile has large copper reserves. Several countries’ main exports are metals and minerals. |

|
Forests provide many resources, such as wood for construction or pulp and paper. Unlike oil, metals and minerals, forests are considered renewable resources. After a few decades, the forests grow back and can be exploited again. Canada and Russia have some of the largest forest areas. |

|
Fresh water is an important resource for drinking water and farming. Some countries, such as the United States, Canada and Brazil, have large fresh water reserves. Water can also be used to produce hydroelectricity, which is used to power industries. |

Unequal access to natural resources only partly explains wealth disparity between countries. This disparity has numerous causes, some dating back to the 19th century. To find out more about this subject, see the concept sheets on the level of development in countries and neocolonialism.
Tools have been developed to assess and compare the level of wealth and its distribution among a population or between countries. The main tools are:
-
Gross domestic product (GDP)
-
Gross domestic product per capita
-
Gini index
Gross domestic product (GDP) is used to calculate a country’s wealth by measuring the total value of all goods and services produced within that country over a given period (usually 1 year).
There are different ways to calculate a country’s GDP. The result of these calculations is always shown in dollars.
This wealth measurement tool is used to:
-
compare countries to one another
-
compare the wealth of a single country over the years to assess the growth or decline of the country’s economy
If a country’s GDP increased by 2.7%, this means that its economy grew. This growth implies that people’s standards of living should have improved due to the increase in wealth, but this is not always the case. Dividing the GDP by the number of inhabitants gives a better idea of the level of wealth across a population. This is known as GDP per capita.
Since almost every country has its own currency and not all currencies have the same value, all GDPs have to be calculated using the same currency. This means that GDP must be converted into a common unit of measurement to reflect purchasing power parity (PPP). All GDPs are calculated based on the same factors so they can be compared.
Purchasing power parity (PPP) is a way of converting the different currencies around the world into a common currency to compare the purchasing power of each currency.
The map above shows the GDP per capita calculated with PPP. The countries with the highest GDP per capita are mainly in Europe and North America. Japan, South Korea and Australia also have high GDPs. These countries are developed countries.
The countries with the lowest GDP per capita are mainly in Africa and Asia. Niger and the Democratic Republic of the Congo (DRC) have some of the lowest GDPs in Africa, while Cambodia and Bangladesh have some of the lowest GDPs in Asia.
The Gini index, or Gini coefficient, measures income inequality among a country’s population. It is calculated on a scale of 0 to 100. At 0, all incomes within the country are equal. The closer the index is to 100, the greater the income inequality.
While GDP is used to compare the wealth of different countries, the Gini index is used to calculate the wealth distribution disparity among a country’s population.
By comparing the Gini index around the world, we see which societies are more equal (lower index) and which are less equal (higher index).
In 2013, South Africa had one of the highest Gini coefficients at 62.5, while Switzerland had one of the lowest Gini coefficients at 24.9. These statistics show that wealth is more evenly distributed among the Swiss population than the South African population.
As another example, the United States has one of the highest GDPs in the world. However, its wealth is unevenly distributed across the population. In 2013, as the country’s Gini index was 41.06. By comparison, Canada’s Gini index was 33.7 in 2010. This data shows that wealth is more evenly distributed in Canada than in the United States.
Two countries with different economies and GDPs can have a very similar Gini index if the wealth distribution in their country is very similar. This was the case for Belgium (25.9) and Kazakhstan (26.3) in 2013.
Countries implement a number of measures to reduce wealth distribution disparity, both within their borders and with other countries.
To reduce wealth distribution disparity in a country, the government can adopt tax policies. These policies redistribute wealth to ensure everyone has access to:
-
health care
-
education
-
social assistance (minimum income for all)
-
minimum wage
-
unemployment insurance
-
old age pension for people aged 65 and over
Fiscal policy is used to determine the ways of financing public spending (state spending), whether through taxes or duties. It ensures that the state has stable and sufficient income to support its spending while not placing too heavy a burden on businesses and taxpayers. It also determines the tax rate.
Governments fund these fiscal measures mainly by collecting personal and corporate taxes. These aim to reduce the gaps in the population as much as possible, since these gaps tend to get bigger. It should be noted that some governments allocate more resources than others to addressing this gap.
In Quebec and Canada, the governments implemented several measures during the 20th century to reduce inequalities among the population, including:
-
publicly-funded health care
-
publicly-funded primary and secondary education
-
basic financial assistance for people who struggle to meet their basic needs
-
temporary financial support to people who have lost their jobs to support them until they find a new job
-
financial support for retirees to ensure a minimum level of income
-
mandatory minimum hourly wage of $13.10 (in Quebec as of May 1, 2020)
To reduce the disparity between states, working conditions are regulated by the government to increase the productivity of individuals and companies. These measures can include improving workplace safety or limiting the maximum number of working hours per week. This helps to increase a country’s wealth, which can then be used to improve living conditions and upgrade infrastructure.
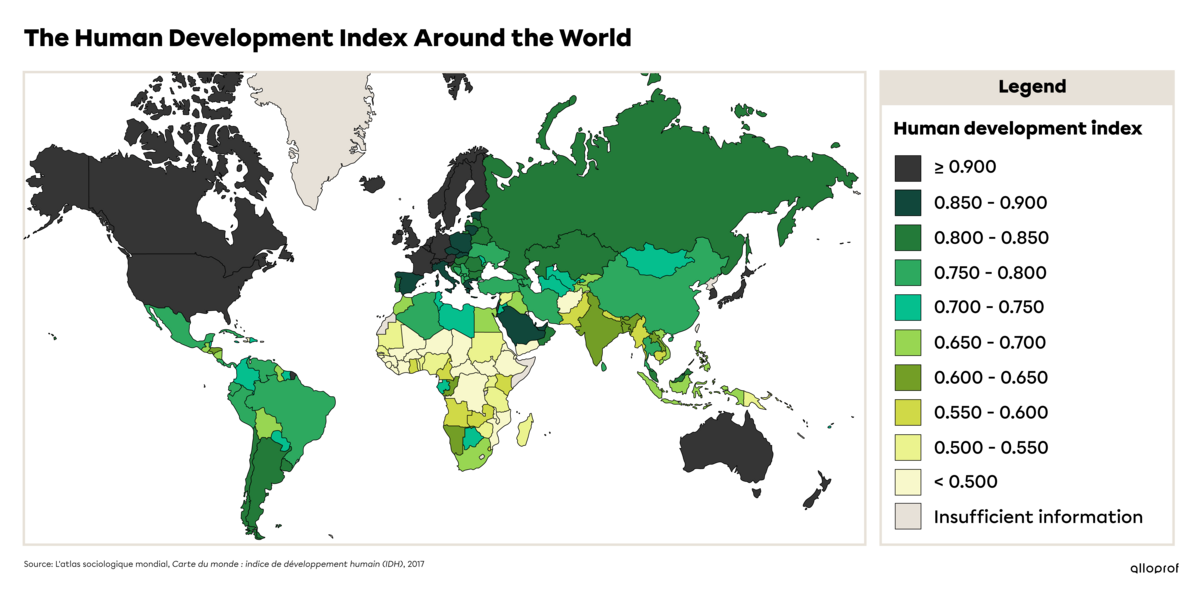
The Human Development Index (HDI) is a socioeconomic indicator that determines the average quality of life of a country’s population by measuring life expectancy, level of education (access to education) and economic output (GDP per capita). The HDI ranges from 0 to 1. The closer the index is to 1, the higher the quality of life.
For example, Canada’s HDI in 2014 was 0.91, while Ghana’s was 0.58.
Like the GDP and the Gini index, the Human Development Index (HDI) shows that there are wide disparities around the world. Countries such as Norway, Germany, Australia and Canada have very high indices, while countries such as Madagascar, Haiti and Yemen have low indices.

Norway has one of the highest HDIs at 0.954, while Haiti has a low HDI at 0.503. Beyond these HDIs, what does life look like in these two countries?
Norway’s population has a life expectancy of 82.1 years at birth and a literacy rate of 99%. Its GDP per capita is $66,831.90.
Haiti’s population has a life expectancy of 65.3 years at birth, about 20.5% lower than Norway’s. Haiti’s literacy rate is 61.7%, over 37% lower than Norway’s. Its GDP per capita is $1800, which is about 2.7% of Norway’s GDP.
According to these indicators, people in Norway have a better average quality of life than people in Haiti. People are generally healthier, better educated and have access to more wealth.
Note: Most of the above data is from and around 2018.
Ladouceur, Maude and Alain Parent. Globe. Cahier d’apprentissage, 2014, p.150-154.
Programme des Nations Unies pour le développement. Rapport sur le développement humain 2019, p. 24-28.