In 2019, the estimated world population was 7.7 billion people. Although this many people live in the world, they are very unevenly distributed. The population density varies greatly because some regions are densely populated while others are less populated. Less populated areas include polar regions, deserts and tropical forests. The map below shows the main population centres in the early 21st century:
- East Asia
- Southeast Asia
- South Asia
- Europe
- Northeastern United States
- Gulf of Guinea
- Southeast Brazil
Population density measures the average number of people living in a given area. It is calculated based on the number of inhabitants per square kilometre (inhabitants/km2).

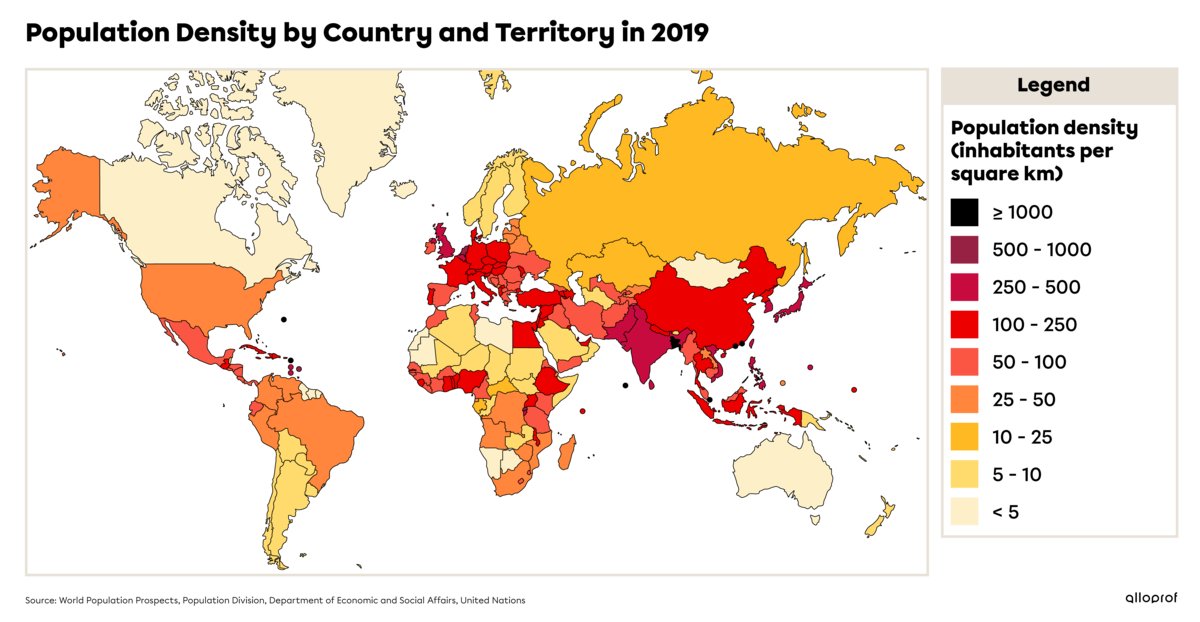
In 2019, 4.6 billion people lived in Asia alone, representing 60% of the world’s population. In the same year, 1.9 billion people lived in South Asia and 747 million people lived in Europe.
Many more people live in developing countries than in developed countries. In 2013, about 5.9 billion people lived in developing countries while 1.3 billion people lived in developed countries. The world’s population is growing, especially in developing countries. Many wonder what impacts overpopulation will have, starting with issues with water and food resources.
-
A developed country is an industrialized country whose economy includes many high-tech industries and where the people enjoy a generally high standard of living.
-
A developing country is less industrialized and the standard of living for people is often low.
-
High-tech industry refers to industries that invest heavily in research and development and produce high-tech products. This includes industries like IT, pharmaceuticals and aerospace.
Urban areas (cities) have a high population density. In 2008, more than half of all humans lived in urban areas. This is especially true in developed countries, which have already gone through industrialization and urbanization. In developing countries, the majority of the population still lives in rural areas, although the urban population is growing steadily, especially in Asia and Africa where urbanization is increasing. Industrialization is growing on these continents, resulting in many people moving to the cities.
-
Urbanization is when a greater number of people live in cities, creating a larger urban area. This process is directly linked to industrialization. Cities offer more jobs and other attractions such as cinemas, shops and theatres.
-
Industrialization is the widespread mechanization and massive increase in factory work. Industrialization is also explained by the transition from an artisanal mode of production, where goods are made by hand, to an industrial mode of production, where goods are made in factories.
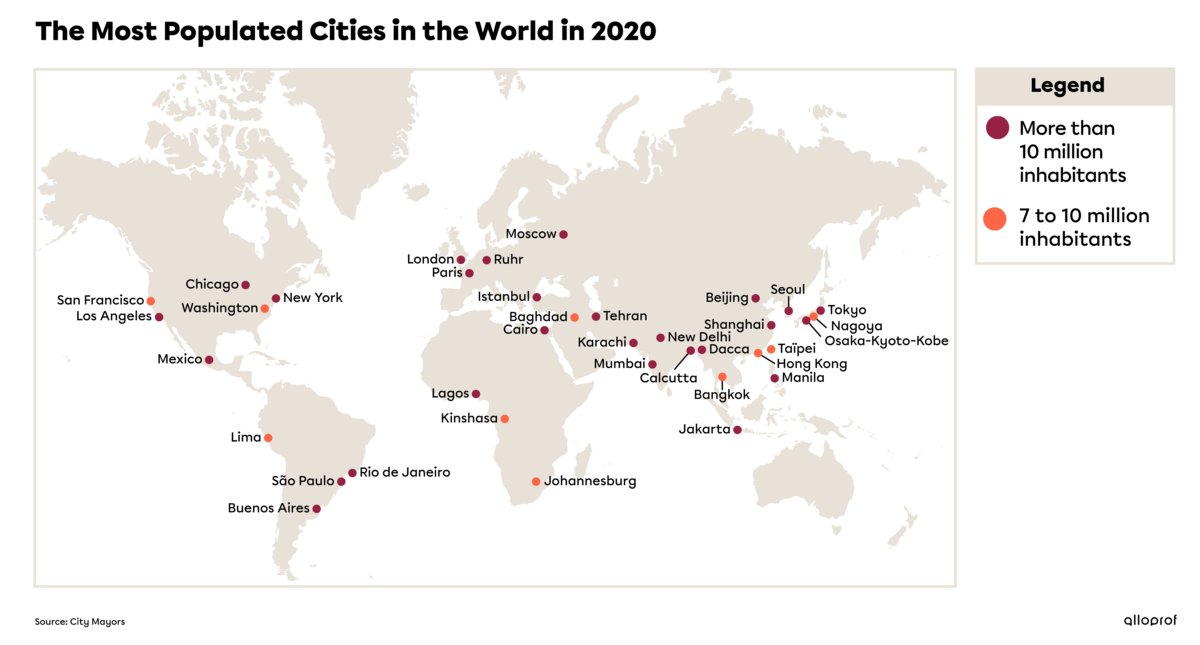
Looking at the map of the most populated cities, most of them are located near the equator, in the intertropical zones. Cities with more than 10 million people are called megacities. 10 million is more than the population of the entire province of Quebec, which was 8 484 965 in 2019. Below is a list of the 15 most populated cities in the world, all of which are megacities.
| Top 15 most populated cities in the world (2020) | |||
| Rank | City | Country | Number of inhabitants |
| 1 | Pearl River Delta | Hong Kong | 65 701 102 |
| 2 | Tokyo | Japan | 42 796 714 |
| 3 | São Paulo | Brazil | 36 315 721 |
| 4 | Jakarta | Indonesia | 35 143 473 |
| 5 | Delhi | India | 26 454 086 |
| 6 | Shanghai | China | 26 317 104 |
| 7 | Séoul | South Korea | 25 525 184 |
| 8 | Cairo | Egypt | 24 439 785 |
| 9 | Mumbai (Bombay) | India | 24 337 933 |
| 10 | Manilla | Philippines | 24 197 302 |
| 11 | New York | Unites States | 23 522 861 |
| 12 | Guangzhou (Canton) | China | 23 426 128 |
| 13 | Lagos | Nigeria | 22 829 561 |
| 14 | Beijing | China | 21 542 000 |
| 15 | Mexico City | Mexico | 20 892 724 |
Brodeur-Girard, Sébastien et collab. Immédiat, 2009, pp. 8-9.
Ladouceur, Maude et collab. Globe, 2014, pp. 71.