Here are the steps to follow to sketch the graph of an absolute value function.
-
Find the coordinates of the vertex
The most important point on the graph of an absolute value function is definitely the vertex. Therefore, it is essential to start by finding the coordinates of the vertex. In |f(x)=a{\mid}x-h{\mid}+k,| the coordinates of the vertex are |(h,k).|
-
Analyze the value of parameter |a|
If |a| is positive, then the graph of the absolute value function opens upwards.
On the other hand, if |a| is negative, the absolute value graph will open downwards. -
Find the |y|-intercept
In the standard form equation of the function, replace |x| with |0| and find the |y|-intercept.
-
Find the zeros (|x|-intercept(s)) of the function
Find the value(s) of |x| when |f(x)=0.| The function may not have any zeros.
-
Plot the points and sketch the function
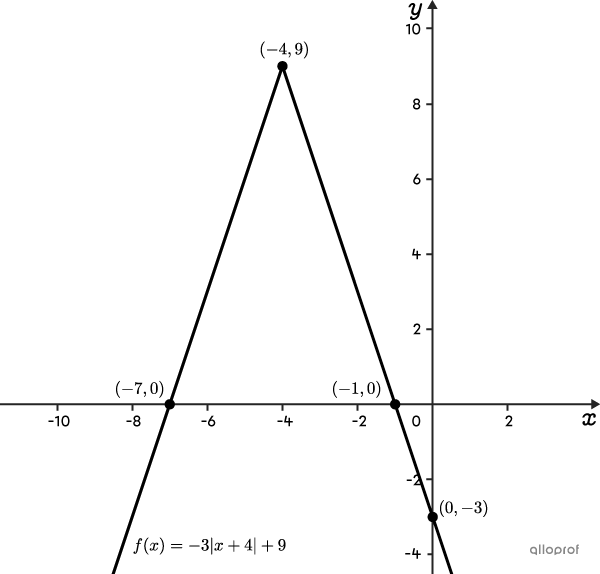
Consider the following function: |f(x) = -3 {\mid}x + 4{\mid} +9.|
-
Find the coordinates of the vertex
||(h,k)=(-4, 9)|| -
Analyze the value of parameter |a|
Parameter |a| is negative |(-3).| So, the function will open downwards.
-
Find the |y|-intercept
||\begin{align} f(0) &=-3 {\mid}0 + 4{\mid} + 9 \\ &= -3 {\mid}4{\mid} + 9 \\ &= -3(4) + 9 \\ &= -12 + 9 \\ &= -3 \end{align}||Therefore, the |y|-intercept is |(0,-3).|
-
Find the zeros (|x|-intercept(s)) of the function
||\begin{align} 0 &= -3 {\mid}x + 4{\mid} + 9 \\ -9 &= -3 {\mid}x + 4{\mid} \\ 3 &= {\mid}x + 4{\mid} \end{align}||From the definition of the absolute value, the quantity |{\mid}x + 4{\mid}| can either be positive or negative.
||\begin{align} 3 &= x + 4 &\text{and}\quad -3&=x+4 \\ -1 &= x & -7 &= x \end{align}||
Therefore, the two |x|-intercepts are |-1| and |-7.|
-
Plot the points and sketch the function
Therefore, we have the vertex at |(-4,9)| and the points |(0,-3),| |(-1,0),| and |(-7,0).| This allows us to draw the 2 half-lines that form the absolute value.

It is not always necessary to calculate the zeros of the absolute value function. Sometimes it is even impossible.
For example, if parameters |k| and |a| are both greater than |0,| then the vertex of the function is located above the |x|-axis and it opens upwards. The 2 half-lines therefore never cross the |x|-axis.

Similarly, if |k| and |a| are both negative, there are no zeros either, because the 2 half-lines are located entirely below the |x|-axis.

In both of these situations, it is not necessary to calculate the zeros. Simply sketch the function with 3 points (the vertex and one point on each half-line).
Graph the function with the equation |f(x)=2 {\mid}2x + 1{\mid} +1.|
-
Find the coordinates of the vertex
Be careful! The equation is not in standard form. It is therefore necessary to manipulate the equation.
|f(x) = 2 {\mid}2x+1{\mid} +1 | becomes |\begin{align} f(x) = 2 \left\vert 2 \left(x+ \dfrac{1}{2}\right) \right\vert + 1 \end{align}.|
Therefore, parameter |a| is 2, parameter |b| is 2, and the coordinates of the vertex |(h,k)| are |\left( - \dfrac{1}{2}, 1 \right).| -
Analyze the sign of parameter |\boldsymbol{a}|
Parameter |a| is positive (it equals 2), so the function opens upwards. -
Calculate the y-intercept
Find the y-intercept by replacing |x| with |0.|
||\begin{align} f(0) &= 2 \left\vert 2 \left(0 + \dfrac{1}{2}\right) \right\vert + 1 \\ f(0) &=3\end{align}||
Therefore, the y-intercept is the point |(0,3).|
We can use the axis of symmetry of the function to find another point. Since the axis of symmetry is |x=h|, the equation is |x=- \dfrac{1}{2}.| Therefore, there is another point whose y-value is |3,| but whose x-value is |-1.| -
Find the zeros (|x|-intercept(s)) of the function
Replace |f(x)| with 0.
||\begin{align} 0 &= 2 \left\vert 2 \left(x + \dfrac{1}{2}\right) \right\vert + 1 \\ -1 &= 2 \left\vert 2 \left(x + \dfrac{1}{2}\right) \right\vert \\ -\dfrac{1}{2}&= \left\vert 2 \left(x + \dfrac{1}{2}\right) \right\vert \end{align}||
There is no x-intercept since an absolute value cannot be equal to a negative number.
-
Plot the points and sketch the function
The vertex is |\left(- \dfrac{1}{2}, 1 \right)| and the points |(0,3)| and |(-1,3)| are known. We can now sketch the graph of the absolute value function. Therefore, we can draw the 2 half-lines that form the absolute value.
