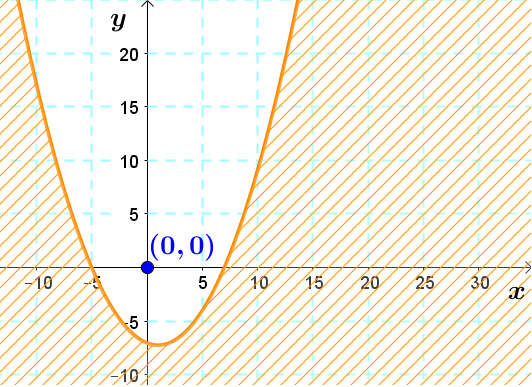
It is possible to represent an inequality on a Cartesian plane. The following are different possible situations.
A boundary line is a line that delimits the solution set of an inequality.
It is possible to represent an inequality on a Cartesian plane, but certain rules must be respected.
1. Draw the function in the Cartesian plane, as if there is an equality (boundary line).
2. Indicate the type of inequality.
-
If the inequality sign is |<| or |>| , we draw a dotted boundary line. The points on the line are not part of the solution.
-
If the inequality sign is |\leq| or |\geq| , we draw a solid boundary line. The points on the line are part of the solution.
3. Determine the solution region.
Since there are an infinite amount of points in the Cartesian plane that meet this constraint, and since it is impossible to define them all precisely, we shade the portion of the Cartesian plane illustrating all the possibilities.
4. Validate the solution region.
We validate the solution region by replacing the inequality’s variables by the coordinates of a point located in the solution region. The point is called a test point.
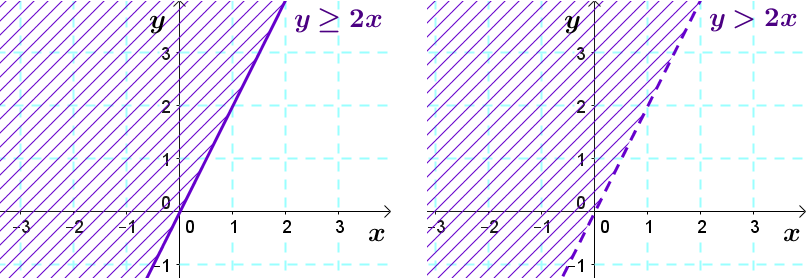
The left boundary line is included in the solution set, while the right one is excluded.
Remember that a straight line can be horizontal ( |y =| constant) or vertical ( |x=| constant).
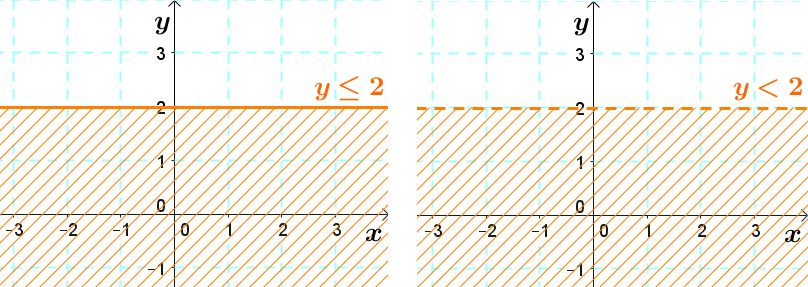
When |y| is equal to a constant, the boundary is represented in the form of a horizontal line.
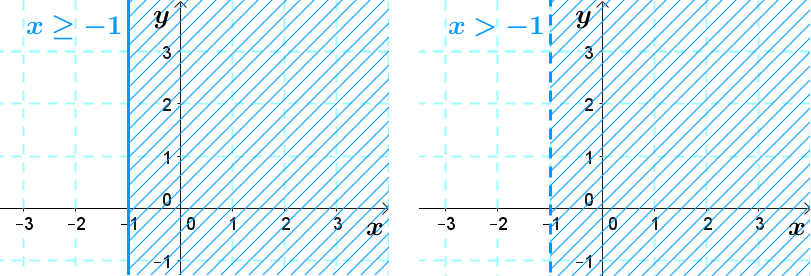
When |x| is equal to a constant, the boundary is represented in the form of a vertical line.
It is possible, by following the steps listed above, to represent a linear inequality with two variables on a Cartesian plane.
For example, consider the function |y > 3x+6.|
1. We first represent the boundary line in the Cartesian plane, as if we had an equality (|y = 3x + 6|.)
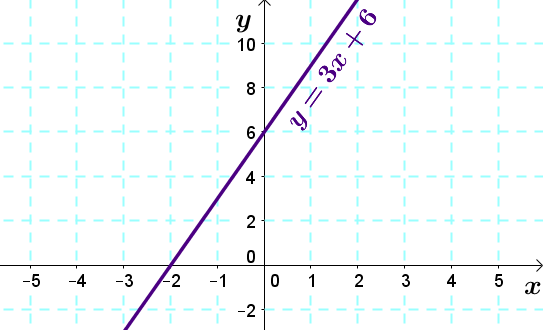
2. Since the sign is |>| , we draw a dotted boundary line.
(Note: parts of the line in the previous step can just be erased.)
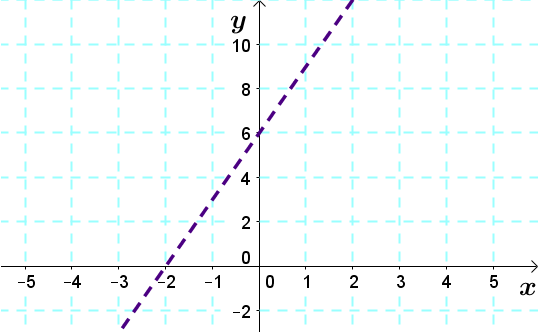
3. Determine the solution region.
First, we take a point in the Cartesian plane and check if it validates the inequality. Take the point |(0,0).|
Replace |x| and |y| in the equation by the point’s coordinates and solve the inequation.
||\begin{align}0&> 3(0)+6\\
0 &> 0+6\\
0 &\color{red}{>} 6\end{align}||
|0| is not larger than |6| . Thus, the point |\left(0,0\right)| is not part of the solution. So, shade on the other side of the boundary line (top left).
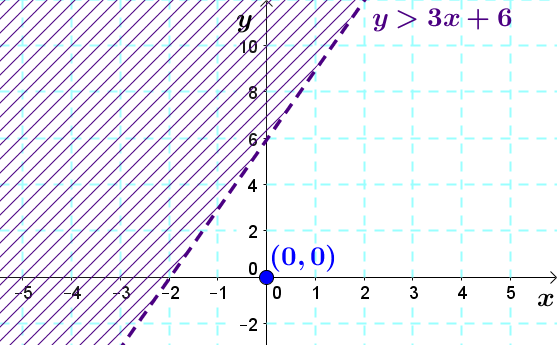
After drawing the boundary line and determining the type of inequality, it is possible to determine the solution region using a random point on the Cartesian plane. It is sufficient to replace the inequality’s variables by the point’s coordinates and to check whether or not they validate the inequality. Therefore:
-
if the test point validates the inequality, it is part of the region to be shaded, i.e., the solution region,
-
if the test point does not validate the inequality, it is not part of the region to be shaded, i.e., the solution region. Thus, it is necessary to shade the opposite region.
1. Find the boundary line equation in the form |y=ax+b.|
2. Determine the appropriate inequality sign (using the test point method).
-
If the line is dotted, there are two choices: |>| or |<|.
-
If the line is solid, there are two choices: |\geq| or |\leq|.
Consider the following graph.
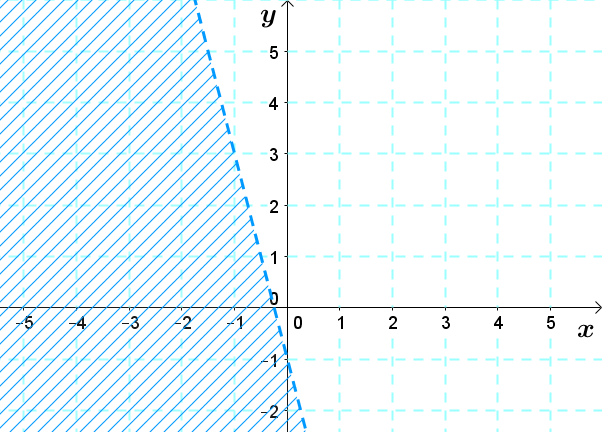
The boundary line passes through points |\left(-1,3\right)| and |\left(0,-1\right).|
1. Finding the boundary line equation requires calculating |a|.
||\begin{align}a &= \displaystyle \frac{\Delta y}{\Delta x}\\ \\
& = \frac{y_2-y_1}{x_2-x_1}\\ \\
&=\frac{-1-3}{0- -1}\\ \\
&=-4\end{align}||
Thus, the result is |y=-4x+b|.
Next, we must calculate |b| by replacing |x| and |y| with the values of a point.
||\begin{align}3&= -4 (-1) + b\\
3 &= 4 + b\\
-1&=b\end{align}||
The boundary line equation is |y=-4x-1|.
2. All that remains is to determine the sign of inequality.
Since the line is dotted, we have two choices: |>| or |<|.
We choose |<| and check if it is the right sign by taking a test point from the shaded area. Take the point |(-1,0)|.
||\begin{align}0 &< -4 (-1) - 1\\
0 &< 4 - 1\\
0&<3\end{align}||
It is true, thus, the inequality sign is adequate.
So, the graph above corresponds to the inequality |y<-4x-1|.
When representing two inequalities in a Cartesian plane, the result is an overlapping area where the shaded areas of each inequality meet. The overlapping area represents the solution region.
Consider the following two inequalities.
||\begin{align}y&>2x-2 & y&<-2x+3\end{align}||
1. We draw the two inequalities as if they were equations.
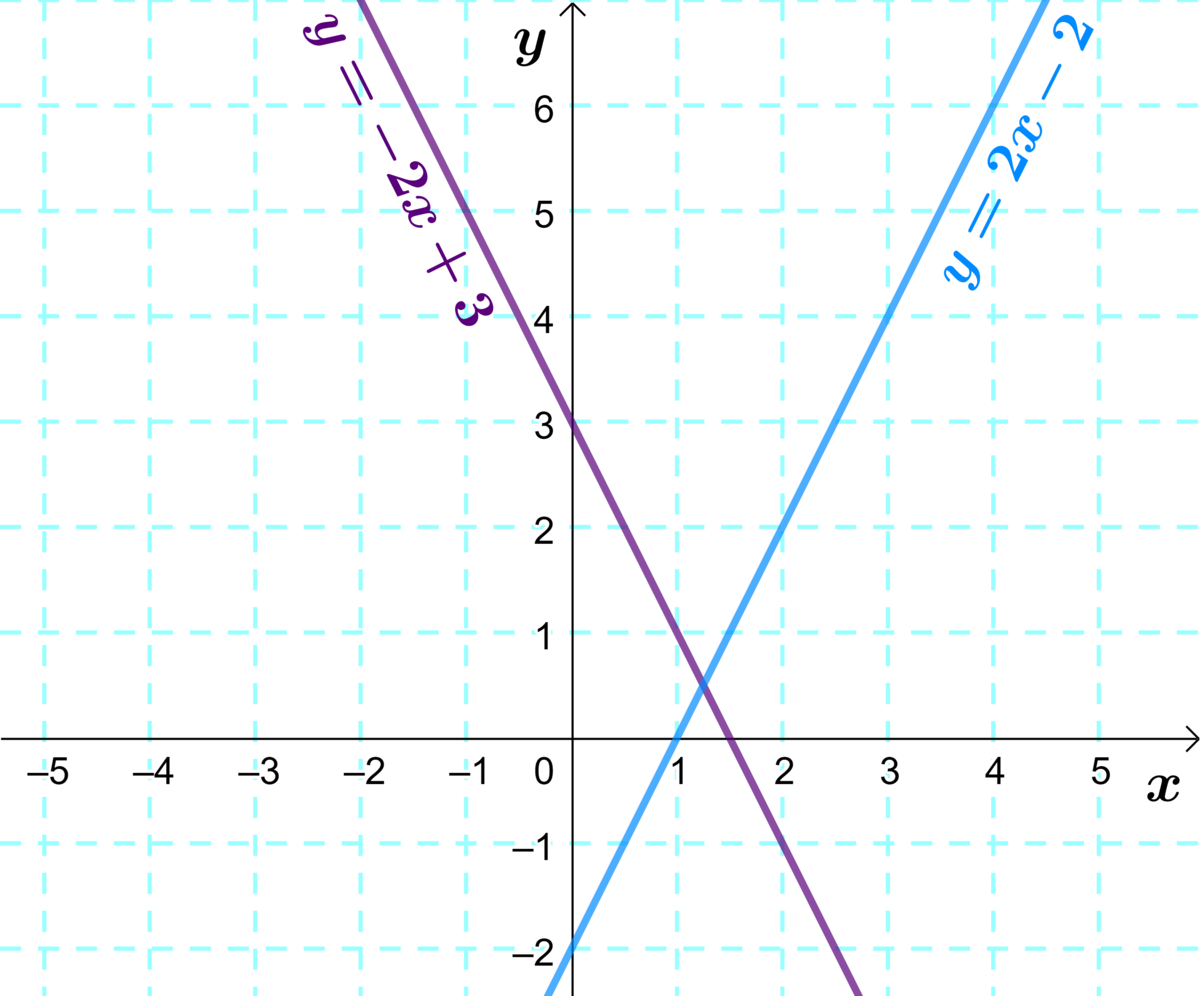
2. Since the signs are |>| and |<| , the boundary lines will be dotted.
3. We determine the shaded areas. Let’s take the point |(0,0)| for both inequalities.
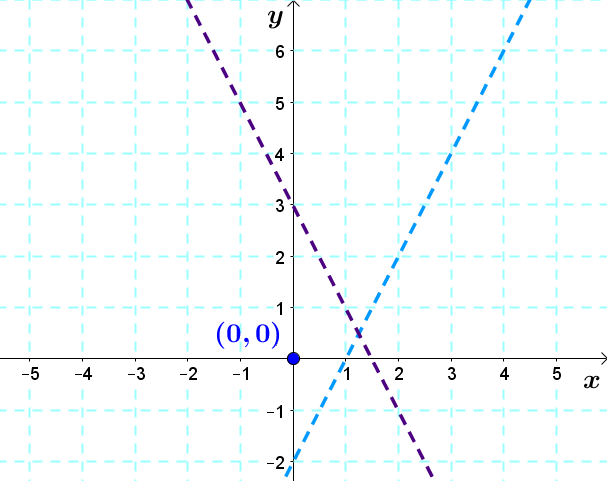
||\begin{align}0&>2 (0)-2 & &\phantom{00000} & 0&<-2 (0) +3\\
0&>-2 & &\phantom{0} & 0&<3\\
&\text{True} & &\phantom{0} & & \text{True}\end{align}|| In both cases, the situation is true, therefore we shade over the point |(0,0)| for both inequalities.
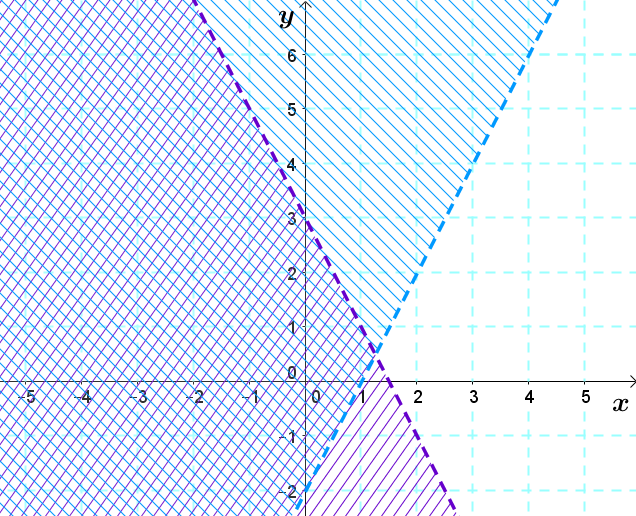
The region where the shaded areas overlap corresponds to the solution region. This is called the intersection of the two inequalities.
By following the steps listed above, it is possible to represent a quadratic inequality with two variables in a Cartesian plane.
For example, consider the equation |y \le 0.2x^2 - 0.4x - 7|.
In this case, the inequality contains an equality. Therefore, we must represent the function using a solid line.
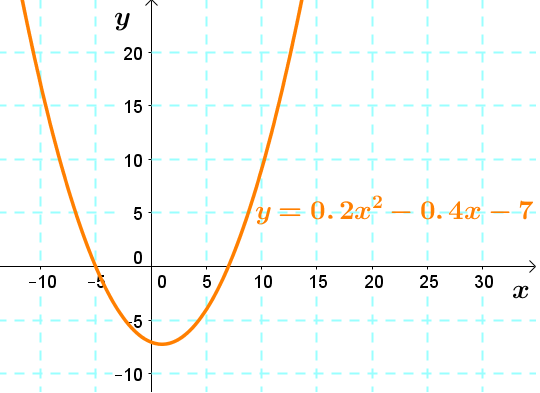
Next, it suffices to use a test point to validate which zone must be selected as the solution region. For example, if we use the point |(0,0)| :
||\begin{align}0 &\le 0,2(0)^2 - 0,4(0) - 7\\
0 &\le -7\end{align}||
The answer is false since |0| is larger than |-7| , therefore it is necessary to select the area where the point |(0,0)| is not found.
