To solve a problem with an absolute value function, it is important to know how the function works and be able to solve an equation out of context. Read up on the following concept sheet if necessary: Solving an Absolute Value Equation or Inequality.
The temperature throughout the day often follows the pattern of an absolute value function, which is the case for a typical beautiful sunny day in November! In the morning at 6 a.m., the temperature was -6 °C. As the sun rose higher in the sky, the temperature steadily increased until it reached a maximum of 9 °C by 4 p.m. From that point onwards, the temperature began to drop until midnight, following the same pattern as it did rising.
a) What was the temperature at noon and midnight?
b) At what hours was the temperature equal to the freezing point?
-
Define the variables
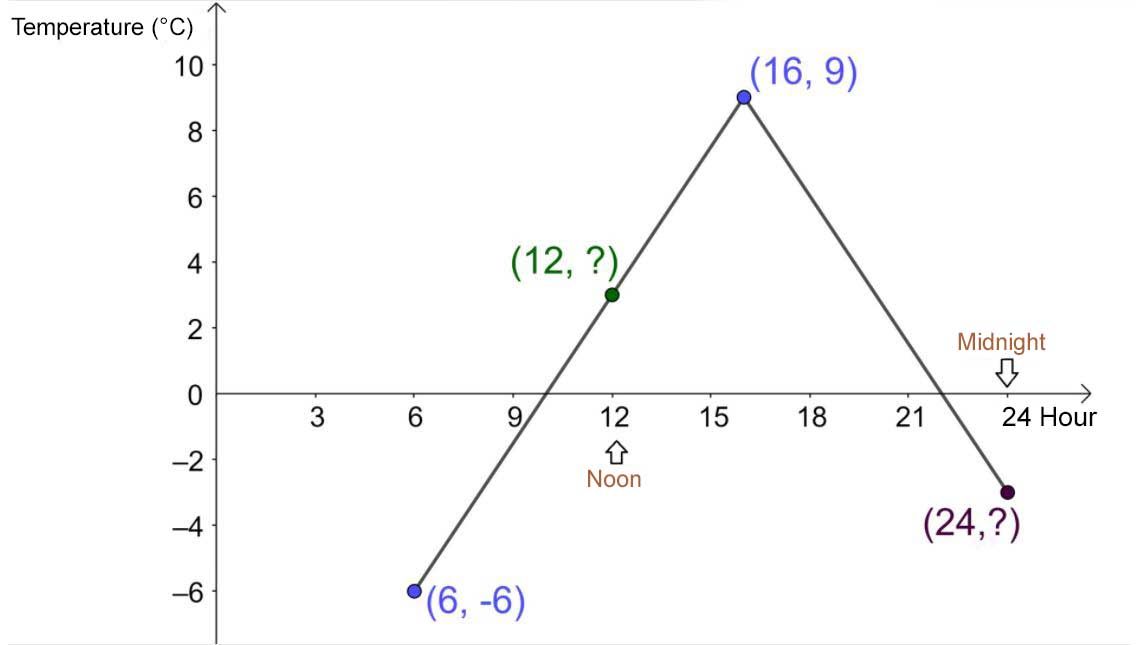
Be careful! Be precise when defining |x.| There are two possibilities: |x| can be the time of day, or the time since 6 a.m. If |x| is the time of day and we do not know what happens before 6 a.m., the graph would look like the following.

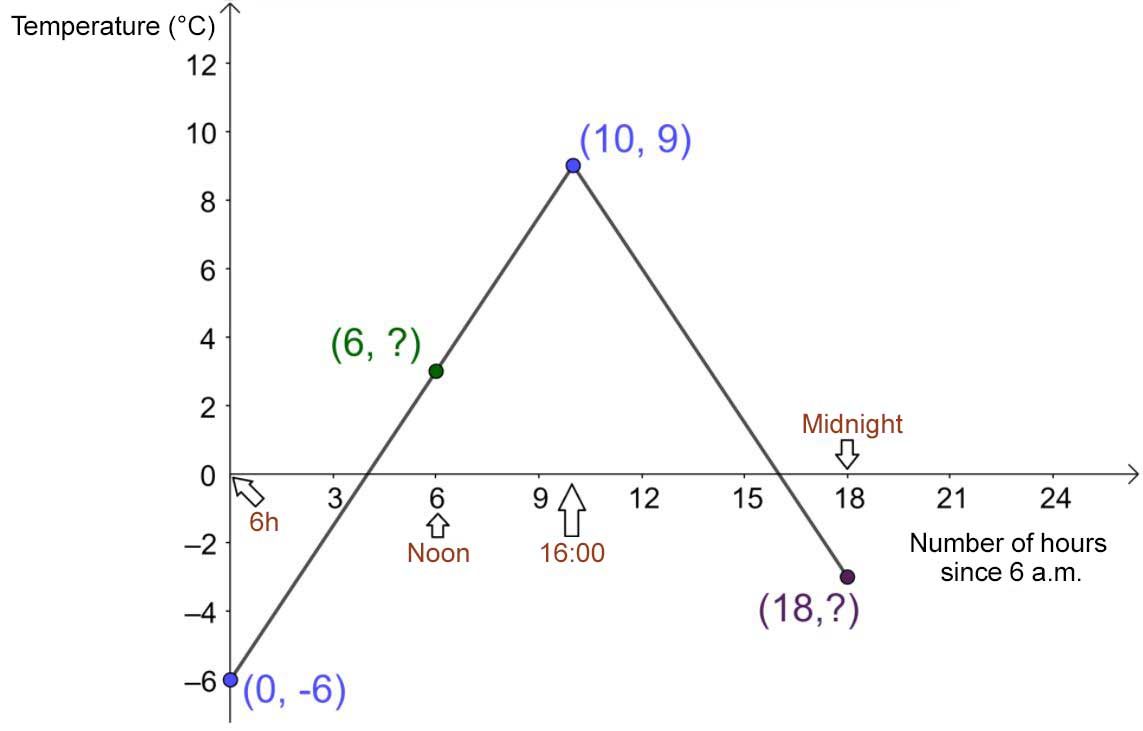
If |x| is the time that has passed since 6 a.m., then at 4 p.m., |x=10| and not |16.| As well, at noon, |x=12-6=6| and at midnight, |x=24-6=18.| The point |(6,-6)| would become |(0,-6)| and would therefore be the |y|-intercept. The graph would look like the following.

The second graph will be used for the rest of the problem. So the variables are the following.
|\color{blue}{x}|: Time elapsed since 6 a.m.
|\color{magenta}{f(x)}|: Temperature (°C)
-
Find the equation
It is mentioned in the statement that the temperature follows an absolute value function, but regardless of this fact, this could be deduced since the rates of decrease and increase are equal. If it wasn’t an absolute value function, it would have been a piecewise function.
To find the equation, use the standard form equation (with the parameters |\color{purple}{a}|, |\color{red}{h}|, and |\color{green}{k}|). First, replace |\color{red}{h}| and |\color{green}{k}| with the coordinates of the vertex |(\color{red}{10},\color{green}{9}).| Then, replace the variables |\color{blue}{x}| and |\color{magenta}{f(x)}| by the coordinates of a point other than the vertex. In this case, use the point |(\color{blue}{0},\ \color{magenta}{-6}).| ||\begin{align}\color{magenta}{f(x)}&=\color{purple}{a} \mid \color{blue}{x}-\color{red}{h} \mid+\ \color{green}{k}\\ \color{magenta}{f(x)}&=\color{purple}{a} \mid \color{blue}{x}-\color{red}{10} \mid+\ \color{green}{9}\\ \color{magenta}{-6}&=\color{purple}{a} \mid \color{blue}{0}-\color{red}{10} \mid+\ \color{green}{9}\\ -15 &=\color{purple}{a} \mid -\color{red}{10}\ \mid\\ -15 &=10\color{purple}{a}\\ \color{purple}{-1.5}&=\color{purple}{a}\end{align}||Therefore, the equation of the function is: ||\color{magenta}{f(x)}=\color{purple}{-1.5} \mid \color{blue}{x}-\color{red}{10} \mid+\ \color{green}{9}|| Note: The value of |\color{purple}{a}| is negative, which is consistent with the graph: the function has a maximum and the V opens downwards. In addition, the value 1.5 indicates the rates of increase (1.5 °C / hour) and decrease (-1.5 °C / hour) of the temperature.
a) To find the temperature at midnight, replace |\color{blue}{x}| with |\color{blue}{18}| and isolate |\color{magenta}{f(x)}.| ||\begin{align} \color{magenta}{f(x)}&=-1.5 \mid \color{blue}{x} -10 \mid+\ 9\\ \color{magenta}{f(x)}&=-1.5 \mid \color{blue}{18} -10 \mid+\ 9\\ \color{magenta}{f(x)}&=-1.5 \mid 8\mid+\ 9\\ \color{magenta}{f(x)}&=-1.5 (8)+9\\ \color{magenta}{f(x)}&=-12+9\\ \color{magenta}{f(x)}&=-3\\\end{align}|| To find the temperature at noon, replace |\color{blue}{x}| with |\color{blue}{6}| and isolate |\color{magenta}{f(x)}.| ||\begin{align} \color{magenta}{f(x)}&=-1.5 \mid \color{blue}{x} -10 \mid+\ 9\\ \color{magenta}{f(x)}&=-1.5 \mid \color{blue}{6} -10 \mid+\ 9\\ \color{magenta}{f(x)}&=-1.5 \mid -4\mid+\ 9\\ \color{magenta}{f(x)}&=-1{.}5 (4)+9\\ \color{magenta}{f(x)}&=-6+9\\ \color{magenta}{f(x)}&=3\\\end{align}||
Answers: At noon, the outside temperature was 3 °C. At midnight it was -3 °C.
b) To determine when the temperature was at the freezing point, remember that this means |0| °C. So, replace |\color{magenta}{f(x)}| with |\color{magenta}{0}| and isolate |x.| Be careful! According to the graph, there should be two instances when the temperature was |0| °C — the first time in the morning when the temperature was rising, and the second time in the evening when the temperature was falling. ||\begin{align} \color{magenta}{f(x)}&=-1.5 \mid \color{blue}{x} -10 \mid+\ 9\\ \color{magenta}{0}&=-1.5 \mid \color{blue}{x} -10 \mid+\ 9\\ -9&=-1.5 \mid \color{blue}{x}-10\mid \\ 6&=\mid \color{blue}{x}-10\mid \\ \end{align}|| From this point, apply the definition of absolute value, which gives 2 equations to solve. ||\begin{align}\color{blue}{x}-10&=6\ \ \ \text{if } x>10\ \ \ \ \ \ \ \text{and } &\color{blue}{x}-10&=-6 \text{ if } x<10\\ \Rightarrow \color{blue}{x_2}&=16\text{:}00 &\Rightarrow \color{blue}{x_1}&=4\text{:}00 \end{align}|| Be careful! Remember that the variable |\color{blue}{x}| has been defined as the time passed since 6 a.m. So, to find the real times when the temperature was at the freezing point, add |6| to both solutions. ||\begin{align}\color{blue}{x_1}&=4\ \ +6=10\text{:}00 \\ \color{blue}{x_2}&=16+6=22 \text{:}00 \end{align}||
Answers: The temperature outdoors was at the freezing point at 10 a.m. and 10 p.m.
The previous example only dealt with equations, not inequalities. A final question that would have included inequalities could be: "During what time interval was the temperature above 5 °C?" To learn how to answer this kind of question, consult the following concept sheet: Solving an Inequality with an Absolute Value.
Pour valider ta compréhension à propos de la résolution de problèmes impliquant la fonction valeur absolue de façon interactive, consulte la MiniRécup suivante.
