In analytical geometry, a half-plane represents the solution set of a first degree inequality with two variables.
A solution set is the set of values that satisfy an equation or an inequality.
In analytical geometry, the concepts of half-plane and first degree inequalities in two variables are closely related. In fact, one is the graphical representation of the other.
The half-plane can be seen as one of the two portions of a plane delimited by a straight line called the boundary line.
A boundary line is a line that delimits the solution set of an inequality.
There are two types of boundary lines:
-
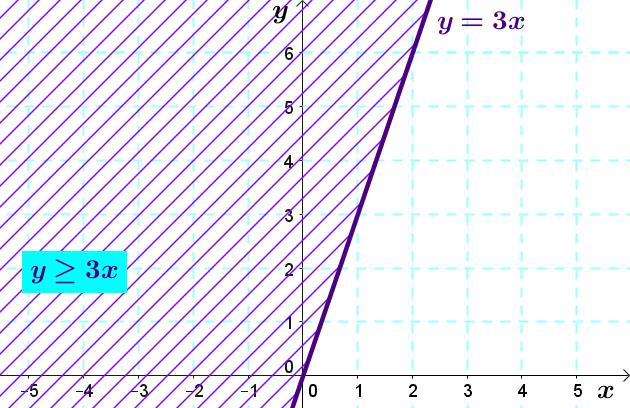
If the inequality is included ( |\leq| or |\geq| ), the border line will be part of the solution set and will be represented by a solid line.
-
If the inequality is not included( |<| or |>| ), the border line will not be part of the solution set and will be represented by a dotted line.
The following half-plane represents the solution set of the inequality |y>3x.|
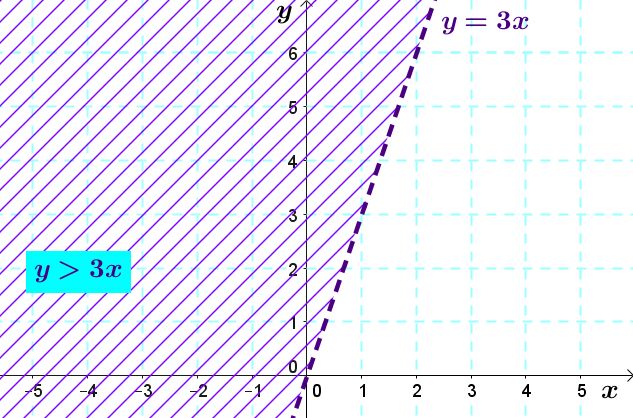
Notice here the boundary line |y=3x| is dotted. This is because the inequality sign of the inequality ( |>| ) is strict.
However, the boundary line of the solution-set of the inequality |y\geq3x| will be a solid line.
A half-plane can also be used to represent a first degree inequality with one variable.
When the inequality includes only:
-
the independent variable |(y),| there will be a straight horizontal boundary;
-
the dependent variable |(x),| there will be a straight vertical boundary.
-
The following half-plane represents the solution set of the inequality |y\leq4.|
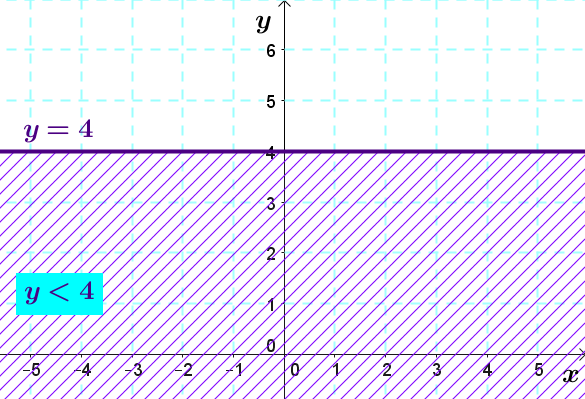
The solution set includes all the points whose coordinates in |y| are less than or equal to |4.|
-
The following half-plane represents the solution set of the inequality |x>-2.|
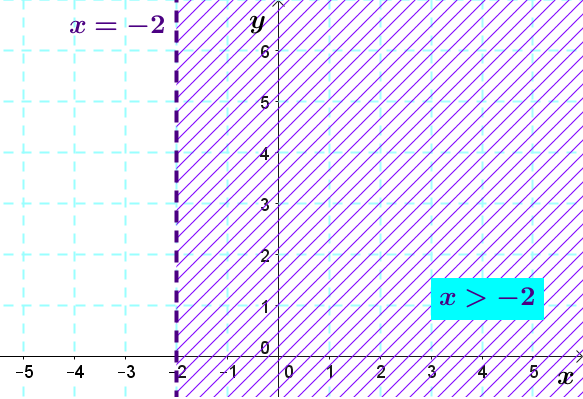
The solution set includes all the points whose |x| coordinate is strictly greater than |-2.|
In some situations, it may be necessary to graph the solution set of a two-variable first degree inequality. Here's how to do it.
-
Write the inequality by isolating the dependent variable
For example: |y>ax+b| -
Sketch the boundary line given by the equation |y=ax+b|
This line will be dotted or solid depending on the sign of the inequality. -
Shade the half plane:
- above the boundary line if the inequality sign is |>| or |\geq|,
- below the boundary line if the inequality sign is |<| or |\leq.|
Be careful! When using this technique, the dependent variable must be isolated to the left of the inequality.
It is possible to check if the correct half-plane was shaded by choosing a test point in the shaded area. It is only necessary to replace the variables of the inequality by the coordinates of this point. If these coordinates verify the inequality, we have drawn the correct half-plane.
Draw the half-plane corresponding to the set solution of the inequality |4x+2y\leq 6.|
- Write the inequality in its functional form
||\begin{align} 4x \color{red}{-4x} + 2y &\leq 6 \color{red}{-4x} \\ 2y \color{red}{\div 2} &\leq (6 - 4x) \color{red}{\div 2} \\ y &\leq - 2x + 3 \end{align}||
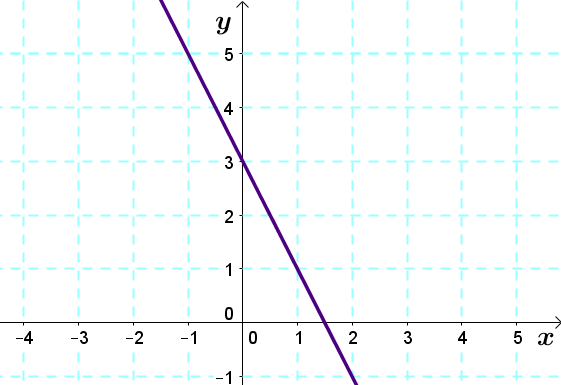
- Sketch the boundary line given by the equation |y=-2x+3|
As the sign of inequality is |\leq,| this line will be represented by a solid line.
- Shade the half-plane corresponding to the set solution of the inequality
Since the inequality sign of the inequality is |\leq ,| it is necessary to shade below the boundary line.
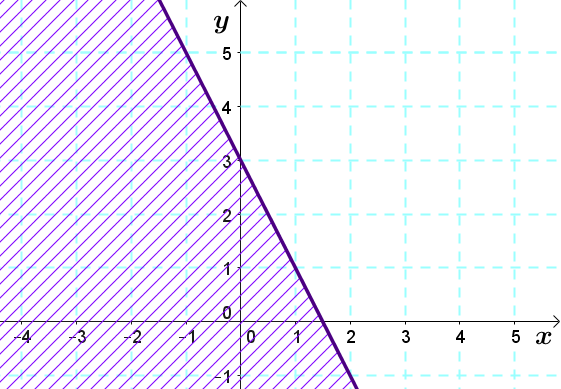
Now check the solution by using a test point. Take the point |(-1,2)| that is part of the shaded region and replace the variables of the starting inequality with its coordinates. ||\begin{align} 4x + 2y &\leq 6 \\ 4(\color{blue}{-1})+2(\color{blue}{2}) &\leq6 \\ -4 + 4 &\leq 6 \\ 0 &\leq 6 \Longrightarrow \text{TRUE} \end{align}||
The coordinates of the test point verify the inequality. So, we can affirm that the above half-plane represents the solution set of the inequality |4x+2y\leq 6|.
If we multiply or divide by a negative number when manipulating the inequality to isolate the dependent variable |(y)|, the direction of the inequality sign needs to be flipped.
It is a good idea to review the notion of inequality to avoid making any errors during manipulation.
Sometimes, the algebraic representation of a half-plane needs to be determined. This algebraic representation will take the form of a two-variable inequality. Here are the steps to follow.
-
Find the equation of the boundary line
-
Choose the right sign of inequality according to the drawn region and the shape of the boundary line
The test point trick still works to validate if the correct sign of inequality was chosen. Just choose a point belonging to the shaded region and replace the variables of the inequality found by its coordinates. If these coordinates satisfy the inequality, the correct direction for the sign of inequality was chosen.
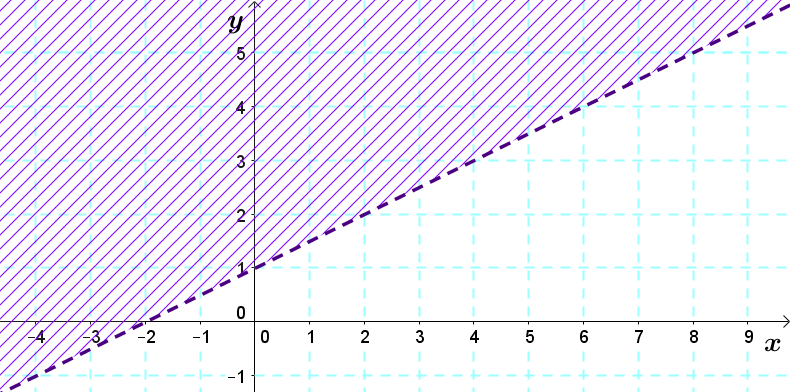
Determine the inequality whose solution set corresponds to the half-plane below.
- Find the equation of the boundary line
Using the graph, it is possible to determine that the |y|-intercept of the boundary line is |1.| We can then calculate the slope using two points belonging to the line. Take the points |(2,2)| and |(4,3).| ||\begin{align}a=\displaystyle \frac{\triangle y}{\triangle x}&=\frac{y_2-y_1}{x_2-x_1}\\ &=\displaystyle \frac{3-2}{4-2}=0{.}5\end{align}|| The equation of the boundary line is then |y=0{.}5x+1|
- Choose the correct sign of inequality
As the shaded region is found above the line, the |>| or sign must be used |\geq.|
Moreover, since the boundary line of the graph is dotted, we must choose a sign that does not include the inequality. The correct sign of inequality is therefore |>.|
The desired inequality is |y>0{.}5x+1.|
It is possible to confirm the inequality using a test point. Take the point |(1,3),| which is part of the drawn region of the graph and replace the variables of the inequality with its coordinates. ||\begin{align}y&>0{.}5x+1\\ \color{blue}{3}&>0{.}5(\color{blue}{1})+1\\ 3&>1{.}5\end{align}|| The inequality is verified and the correct direction for the sign of inequality was chosen.