A relation is present when a link exists between two variables. Generally, there is an independent variable that influences a dependent variable.
There are several ways to represent a relation between variables.
A relation is defined as a function if each value of the independent variable has only one corresponding value for the dependent variable. If not, the relation cannot be considered a function.
A verbal description generally describes a function. Ideally, it should contain three elements:
-
the identification of variables;
-
the initial state of the situation;
-
the description of the behaviour of the variables in relation to each other.
Certain types of words or expressions are often found in the description. For example: according to, depending on, etc.
Julien calls a plumber to help him do some work at home. The plumber’s rate is based on the number of hours worked: he charges |$35| for his travel expenses and |$50| for each hour worked.
A table of values is a chart that includes ordered pairs of values.
-
These pairs allow a relation to be depicted numerically.
-
A table of values can be represented horizontally or vertically.
-
The independent variable is in the first row or column of the table of values, and the dependent variable is in the next row or column.
The cost of a plumber as a function of time can be represented numerically as follows.

This relation qualifies as a function since there is only one value of the dependent variable (rate) for each value of the independent variable (time).
It is possible that the same numerical value is repeated in a table of values.

If the independent variable (|x|) repeats, the relation cannot be called a function.

The graph gives the set of possible solutions for a relation (|R|) between two variables. Therefore, the graph is the extension of the solution set; in other words, it illustrates the enumeration of the possible pairs of solutions.
The cost of a plumber as a function of time can be written as follows.
|R = {(0,35), (1,85), (2,135), (3,185), (4,235), ...}|
This relation can be qualified as a function since there is only one value of the dependent variable (cost) for each value of the independent variable (time).
It can happen that the same numerical value is repeated in a graph.
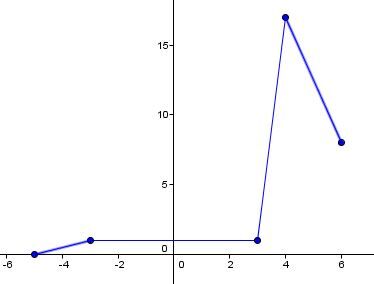
If the dependent variable (|y|) repeats, the relation can be called a function.
|R = {(-5,0), (-3,\color{red}{1}), (3,\color{red}{1}), (4,17), (6,8)}|
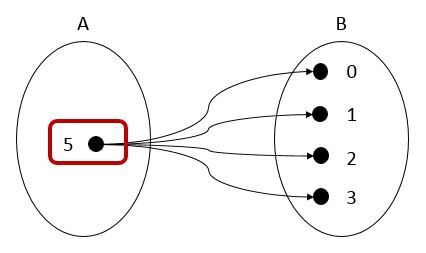
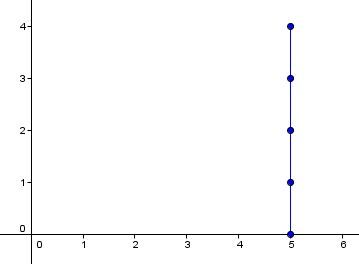
If the independent variable (|x|) repeats, the relation cannot be called a function.
|R = {(\color{red}{5},0), (\color{red}{5},1), (\color{red}{5},2), (\color{red}{5},3), (\color{red}{5},4)}|
Relation mapping can also be used to visually represent the relationship between two variables.
-
A starting set A contains the values of the independent variable.
-
An arrival set B contains the values of the dependent variable.
-
Arrows associate each value of the independent variable with the value of its corresponding dependent variable.
The cost of a plumber as a function of time can be visually represented as follows.
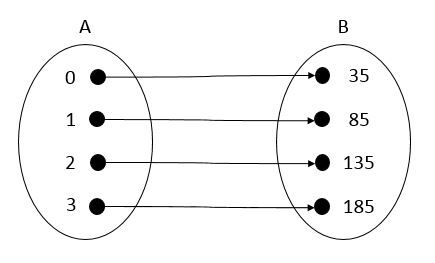
This relation is classified as a function since there is only one value of the dependent variable (rate) for each value of the independent variable (time).
The same numerical value may be repeated in the map of a relation.
If the dependent variable (|y|) repeats, the relation can be called a function.
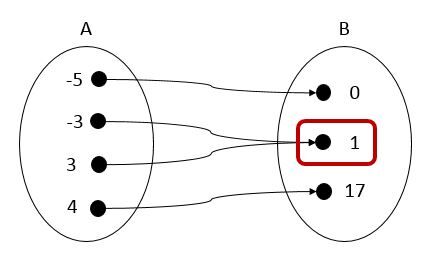
If the independent variable (|x|) repeats, the relation cannot be called a function.
The Cartesian plane makes it possible to graphically represent the behavior of a variable as a result of another.
-
The independent variable is associated with the |x|-axis.
-
The dependent variable is associated with the |y|-axis.
-
The graph can take the form of a scatter plot, a line, a curve, or a set of curves depending on the type of relation it represents.
The cost of a plumber as a function of time can be graphed as follows.
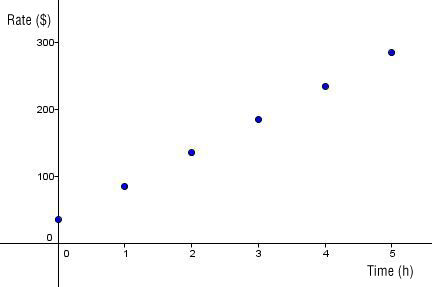
This relation can be classified as a function since there is only one value of the dependent variable (rate) for each value of the independent variable (time).
The same numerical value can be repeated in the Cartesian plane.
If the dependent variable (|y|) repeats, the relation can be called a function (on the left). On the other hand, if the independent variable (|x|) repeats, the relation cannot be called a function (on the right).
A rule signifies an equality which expresses a consistent relation between the variables. Generally:
-
the independent variable is represented by |x;|
-
the dependent variable is represented by |y.| When it is a function, it can also be written as |f(x).|
The letters used to name the variables can also change.
The cost of a plumber as a function of time can be described as follows.
-
The price in |$| is |y| or |f(x).|
-
The time in hours is |x.|
The rule can therefore be expressed as follows: |f(x) = 50x + 35.|
Pour valider ta compréhension à propos des modes de représentation dans les situations de proportionnalité, les situations inversement proportionnelles et les suites arithmétiques, consulte la MiniRécup suivante.
