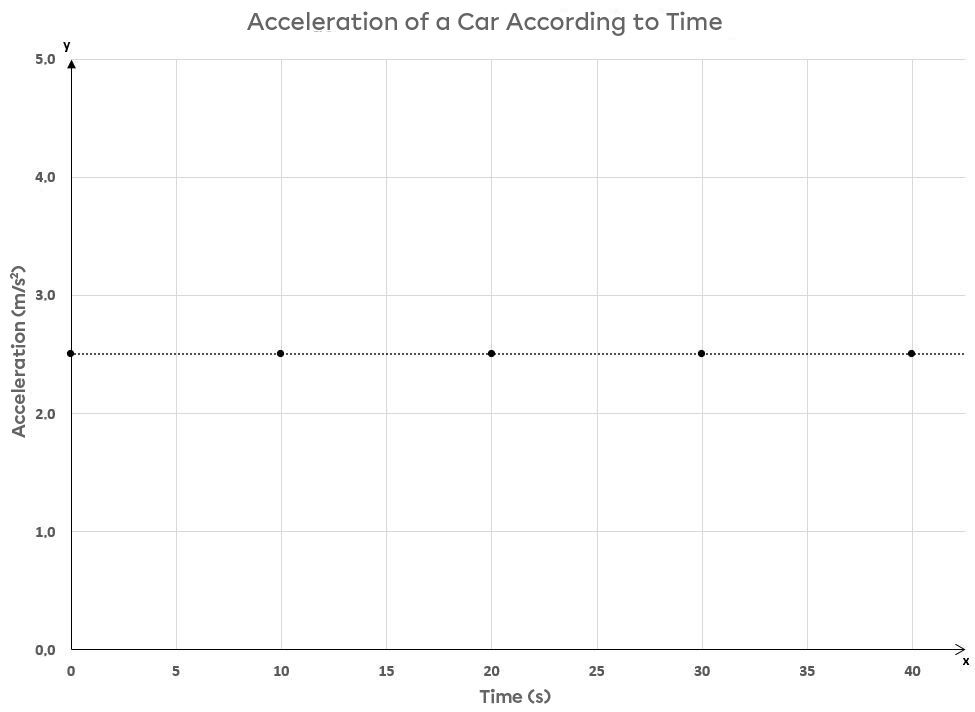
The relationship between acceleration and time in UARM is described by a null relationship in which the acceleration is constant for the total duration of the motion.
To observe this relationship, it is possible to represent the acceleration values of an object according to time in a graph.
Here, consider the motion of a car accelerating after stopping at a stop sign. The acceleration of the car at different stages of its motion has been determined.
|
Acceleration of a Car According to Time |
|
|---|---|
|
Time |\text {(s)}| |
Acceleration |\text {(m/s}^2)| |
|
|0| |
|2.5| |
|
|10| |
|2.5| |
|
|20| |
|2.5| |
|
|30| |
|2.5| |
|
|40| |
|2.5| |
The graph below shows the acceleration of the car according to time.

The resulting relationship is a null function, which means that the acceleration does not change during a given time interval. The acceleration is therefore constant during the car’s trajectory.
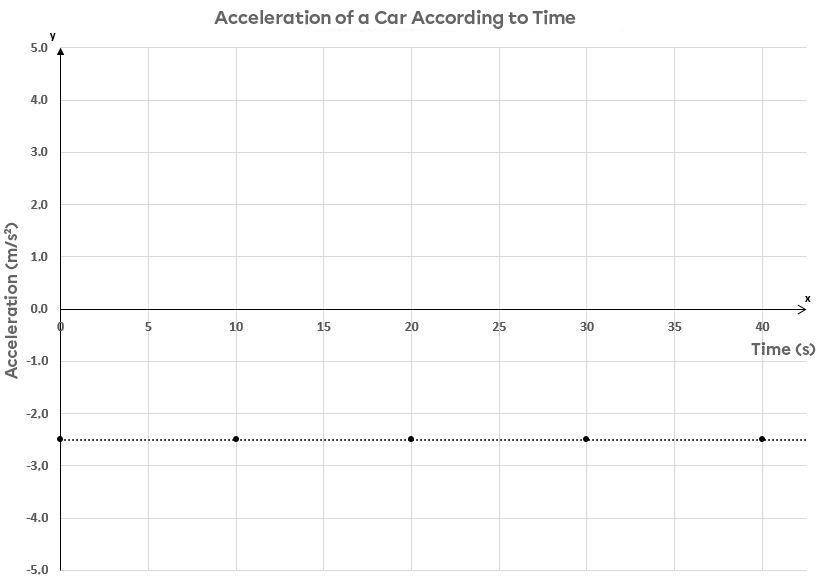
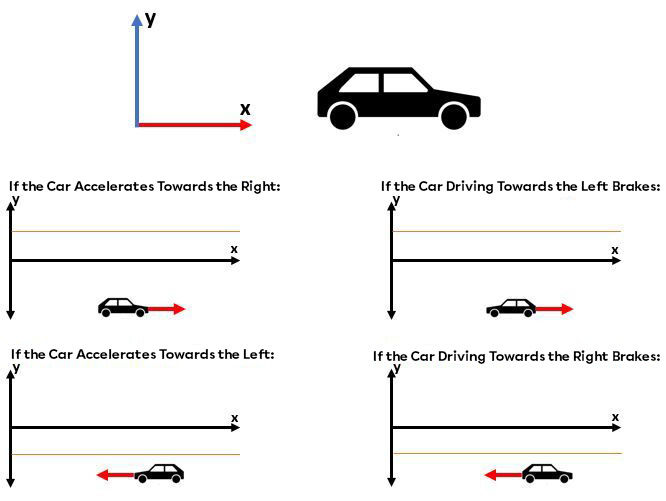
If the acceleration was below the |x|-axis, it would be negative. This means that the speed of the car would change in the opposite direction of the reference system. For example, if a car brakes to stop at a traffic light, the resulting acceleration could be illustrated by the data below.
|
Acceleration of a Car According to Time |
|
|---|---|
|
Time |\text {(s)}| |
Acceleration |\text {(m/s}^2)| |
|
|0| |
|-2.5| |
|
|10| |
|-2.5| |
|
|20| |
|-2.5| |
|
|30| |
|-2.5| |
|
|40| |
|-2.5| |
The graph below shows acceleration according to time.

If the resulting relationship is a null function below the |x|-axis, the acceleration does not change during a given time interval.This means that the acceleration is constant, but negative, during a car’s trajectory.
To determine the change in speed of the car during an interval of time, the area under the curve is simply used to obtain the change in speed during such an interval. This technique applies in any acceleration graph.
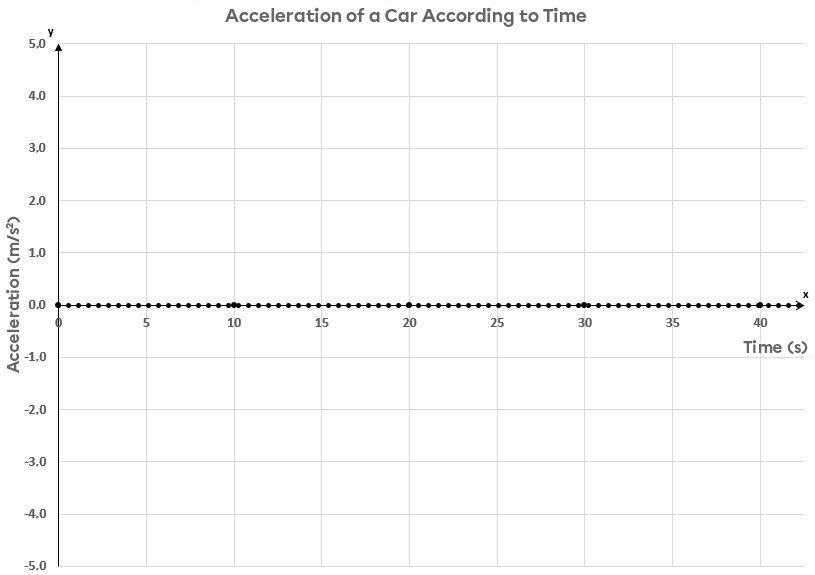
If the resulting line were superimposed on the |x|-axis, the acceleration would be zero and the speed constant, as in URM.

In a graph of acceleration according to time, the position of the line relative to the |x|-axis indicates the observed change in speed. If the line is located at the top of the |x|-axis, this indicates a positive change in speed. On the contrary, if the line is below the |x|-axis, this suggests a negative change in speed. However, it is not possible to know from this type of graph whether the speed is positive or negative: the direction of motion cannot be determined solely based on the graph. It is important to have other data to determine the direction of the trajectory.

Pour valider ta compréhension à propos du MRUA de façon interactive, consulte la MiniRécup suivante :
