An individual's life cycle includes the characteristics related to their reproduction and survival.
Life cycles vary from species to species, depending on the age at which individuals can reproduce, the frequency of reproduction, and the number of offspring they produce.
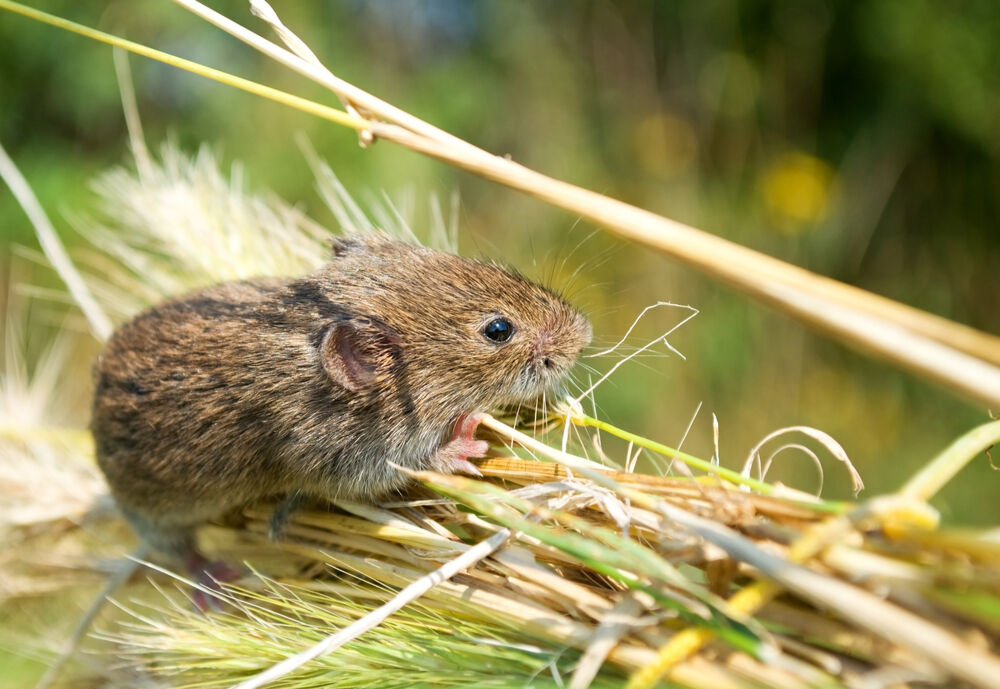
The house mouse is sexually mature at the age of 6 weeks and can have 5 to 10 litters of around 6 mice per year (Centre d’expertise environnementale du Québec, 2006).

Petr Pavluvcik, Shutterstock.com
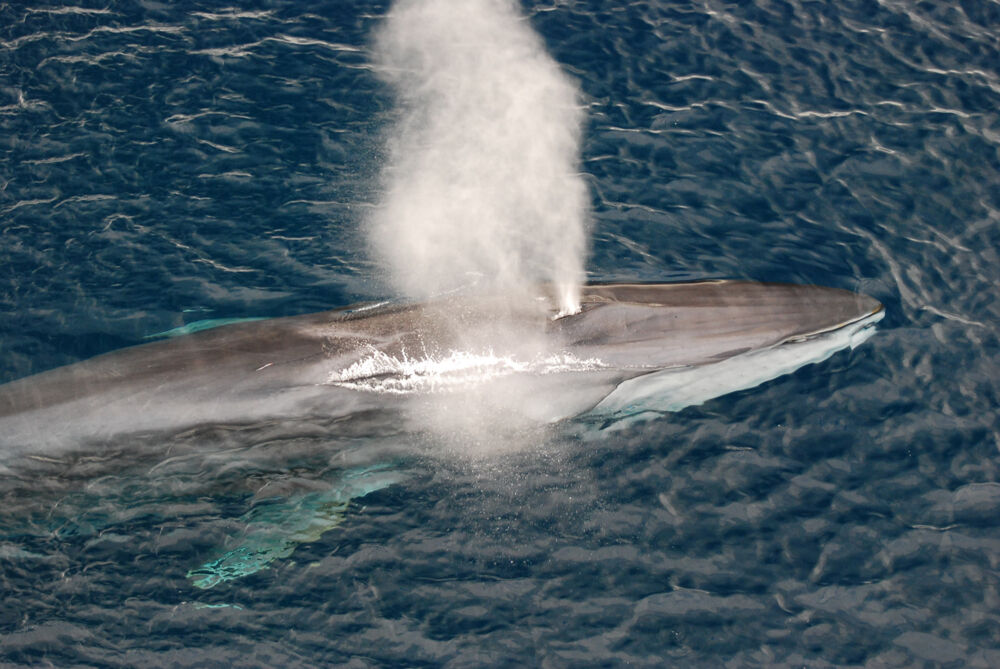
The female fin whale is sexually mature at the age of 7 and gives birth to a single calf every 2 to 3 years (Committee on the Status of Endangered Wildlife (COSEWIC), 2005).

Juan Gracia, Shutterstock.com
A life cycle influences the number of births in a population and, therefore, the size of that population.
Life cycles are affected by biotic and abiotic factors. Changing the life cycles of individuals will impact the size of a population.
Blueberries grow best in acidic soils. The acidity of the soil is an abiotic factor that promotes the survival and likewise the reproduction of these plants. The size of the blueberry population tends to increase under such circumstances.
On the other hand, basic soil does not support the needs of blueberries and is detrimental to their survival. The size of the blueberry population therefore tends to decrease in these areas.

spwidoff, Shutterstock.com
The size of the prey population and that of the predator population within a territory are interrelated. In fact, predation is a biotic factor that influences the size of the prey population, and the presence of prey is a biotic factor that impacts the size of the predator population.
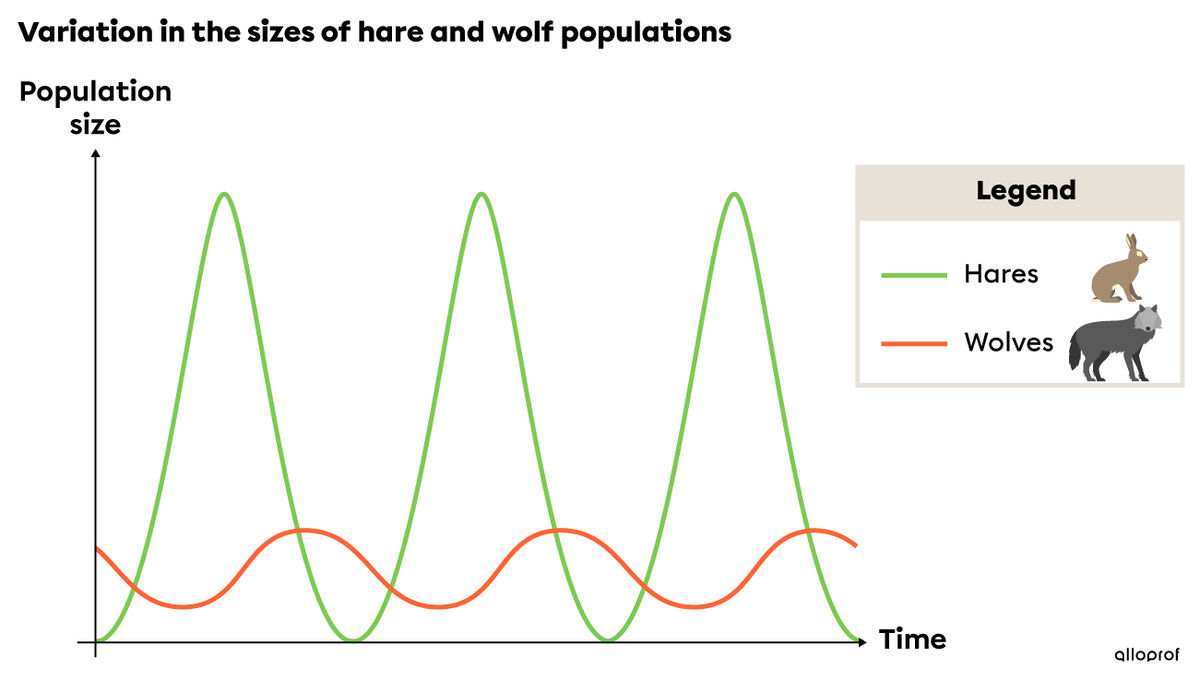
The following graph shows the variation in the sizes of a hare population and a wolf population in a given area.

The wolf is a predator of the hare; thus, when the hare population increases, the wolves have greater access to food. Survival then becomes easier, so they reproduce more easily and their population increases.
At the same time, the increase in the wolf population means that fewer hares survive and reproduce. Their population then shrinks.
When the hare population declines, wolves must compete for access to food. The wolves will have a harder time surviving. They reproduce less, meaning the wolf population will decrease.
The growth of a population is the change in the size of a population.
The growth of a population is calculated by taking the number of individuals entering the population and subtracting the number of individuals leaving the population.
It is calculated using these 4 factors:
- births (the number of live births);
- mortality (the number of deaths);
- immigration (the number of individuals from other populations);
- emigration (the number of individuals leaving the population for another population).
|\text{Growth of a population} = (B + I) - (D + E)|
where
|B| represents the number of births
|I| represents the number of immigrants
|D| represents the number of deaths
|E| represents the number of emigrants
The growth of a population is positive if the population size increases, or negative if the size decreases. It can also be zero if the size of the population is maintained over time.
Over a period of one year, a census was performed on a population of great blue herons that determined there were 14 births, 12 deaths, 5 immigrants, and 9 emigrants. What was the population growth during this year?
|\begin{align}\text{Growth of a population} &= (B + I) - (D + E)\\ \text{Growth of a population} &= (14 + 5) - (12 + 9)\\ \text{Growth of a population} &= 19 - 21 \\ \text{Growth of a population} &= -2\end{align}|
The change in population was -2. The population size shrunk.
Centre d’expertise en analyse environnementale du Québec. (2006). Paramètres d’exposition chez les mammifères, Souris commune, p. 12. http://www.ceaeq.gouv.qc.ca/ecotoxicologie/mammifere/Souris_commune.pdf
Comité sur la situation des espèces en péril (COSEPAC). (2005). Mise à jour Évaluation et Rapport de situation du COSEPAC sur le Rorqual commun Balaenoptera physalus au Canada, p.16-17. https://www.registrelep-sararegistry.gc.ca/virtual_sara/files/cosewic/sr_fin_whale_f.pdf