The significant increase in population and the overconsumption of goods and services have a major impact on the environment. For several years, scientists have tried to accurately measure the impact of human activity on the environment. One of the questions they ask is whether the Earth will continue to be able to provide the resources we need or whether we’re depleting them. To answer this question, scientists have developed the ecological footprint measurement tool.
The ecological footprint is an estimate of the surface area of land or water required for an individual, company or country to support their way of life or activities. It includes all the resources needed to meet their needs and to ensure the disposal of the waste they produce.
To summarize, the ecological footprint is the surface area of the planet that we use to obtain all the resources necessary to meet our needs and wants (eat, work, play or clothing), but also to dispose of our waste. The greater the consumption of resources and the production of waste, the greater the ecological footprint.
The ecological footprint is expressed in global hectares (gha) or global hectares per capita (gha/capita). A global hectare differs from a hectare in its capacity to produce resources and absorb waste.
A global hectare measures 10 000 m2, which is the same size as just under two football fields (an American football field is 5355 m2).
This is a valuable tool that compares the resources we consume and the waste we produce with the planet’s capacity to absorb this waste and generate new resources to replace those that are used. For example, in 2019, humanity began living on credit by July 29. This is known as the Earth Overshoot Day. This means that by that date, humanity has already used all the natural resources that the Earth has to offer for the entire year, according to Global Footprint Network (GFN) calculations. In 2019, we used the Earth’s resources 1.75 times faster than the rate at which they can regenerate.
Calculating a population’s ecological footprint
Occupied surface area (gha) + Surface area (gha) used to produce resources + Surface area (gha) needed for waste disposal
= Ecological footprint (gha)
To determine whether the ecological footprint is low or high, it must be compared to the surface area of the planet that can be exploited by humans (excluding, among other things, the vast area covered by the ocean).
Below are the different exploitable surface areas to be considered.
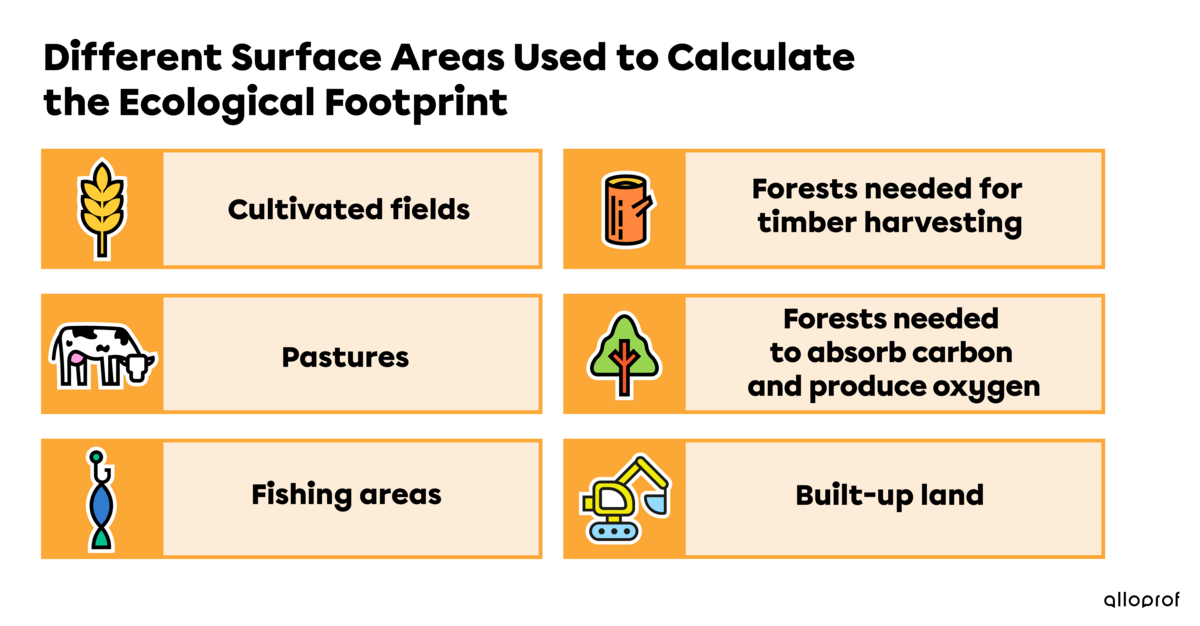
These areas add up to a total of 12 billion hectares. The planet's exploitable surface area is therefore vast. Using a quick calculation, taking into account the world population of 7.7 billion, there would be 1.6 gha available for each human on the planet.
In other words, if each person used an area of about three football fields in their lifetime to meet their needs and dispose of their waste, the Earth should have the capacity to meet our needs and produce what we need. The current problem is that each human uses an average of 2.3 gha (about 4.3 football fields) in their lifetime.
Several factors can affect a population’s ecological footprint, two of the most important being the number of inhabitants and the level of consumption. The larger the population and the higher the level of consumption, the more resources are used and the more waste is produced.
The long-distance transport of goods can have a significant impact. The production or use of certain types of products and foods can also influence a population’s ecological footprint, as some products require larger areas.
The following diagram shows the ecological footprint of producing one kilogram of beef.

-
10 m2 of pasture (an area covered in grass eaten by livestock such as cows)
-
11 m2 of cultivated area for the grain needed to feed the animal
-
2.4 m2 of area used to build stables, slaughter facilities, etc.
-
21 m2 of forest area needed to absorb the CO2 emitted by the animal’s flatulence and by vehicles used to transport the meat. In short, all the CO2 emitted from the animal’s birth until it is sold in pieces in a grocery store.
So, it takes an area of 44 m2 to produce a single kilogram of beef.
The more the demand for meat increases, the more farmland must be expanded to meet the demand. This expansion often leads to more deforestation and more use of pesticides, destroying ecosystems in the process.
It takes 15 000 litres of water to produce one kilogram of beef. Most of it is used to provide water to the animal, water the fields where it grazes and clean the facilities where it lives and is killed.
Deforestation is the human action of permanently eliminating an area of forest.
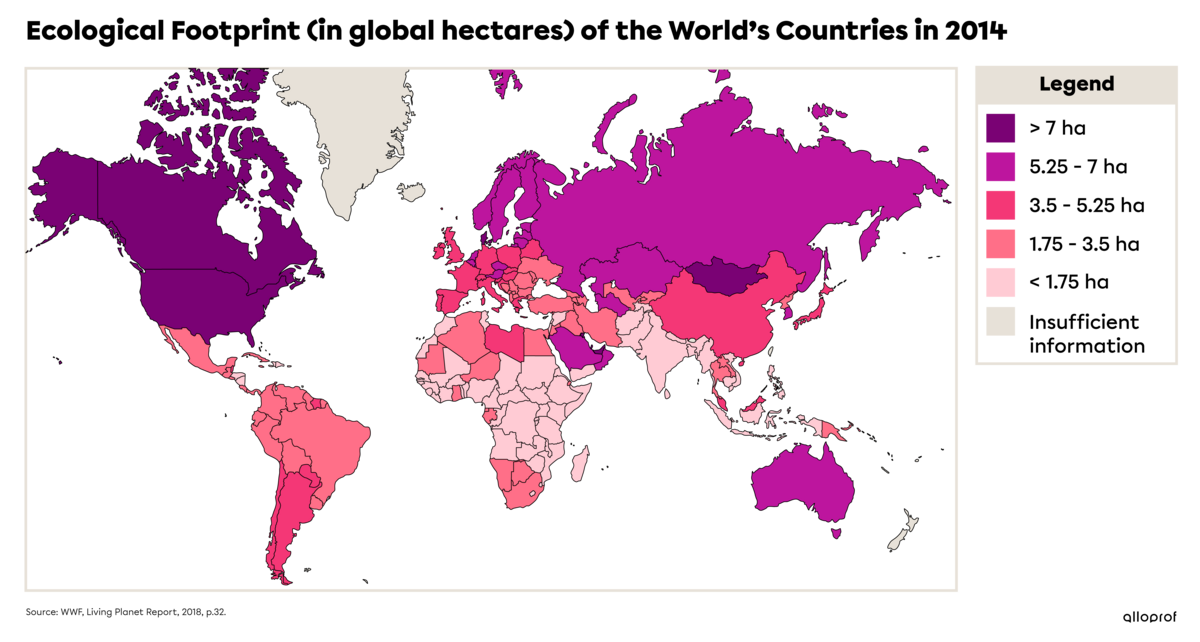
Note about the map
Countries with a high ecological footprint are often those that consume the most fossil fuels, such as oil and coal.
When comparing the ecological footprints of different countries, there is an obvious disparity, meaning there are lifestyle differences between industrialized countries and developing and emerging countries.
According to Global Footprint Network (GFN) statistics, the ecological footprint of Canadians in 2016 was 7.7 gha. This means that each Canadian was using natural resources equivalent to 7.7 hectares of exploitable land to live, or just over 14 football fields (compared to the 1.6 gha that the planet currently has the capacity to provide). The ecological footprint of citizens in other countries in the same year was:
|
Countries |
Ecological footprint (gha) |
Equivalent area in football fields |
|---|---|---|
|
Luxembourg (developed country) |
15.3 |
28.57 |
|
Brazil (emerging country) |
2.8 |
5.23 |
|
Haiti (developing country) |
0.7 |
1.31 |
Data source: Global Footprint Network, 2019.
For the Earth to produce what we need to meet our level of consumption and eliminate our waste, we would need to have an ecological footprint smaller than two football fields per capita. In reality, most people exceed this limit.
For more information, visit the Global Footprint Network’s website to view the ecological footprint of different countries on an interactive map.
When comparing the ecological footprint of different countries, the country’s ecological footprint is often divided by the number of inhabitants, which provides the number of gha per capita. This makes it easier to compare each person’s impact.
The ecological footprint per country is an average. Within the same population, the footprint can vary greatly from one person to another. In the following example, Canadian 2 has a higher ecological footprint than Canadian 1.
|
Canadian 1 |
Canadian 2 |
|---|---|
|
Zero-waste lifestyle |
Doesn’t worry about waste (doesn’t compost or recycle) |
|
Gets around by bicycle |
Owns two new cars that he uses frequently |
|
Doesn’t own a television, lives in an apartment that collects rainwater for washing and showering The apartment is heated by a geothermal system (natural heat extracted from the ground) |
Has four TVs for the entire family |
For individual people, in Canada and around the world, the areas that have the greatest impact on the ecological footprint are:
-
transportation (for travel)
-
home heating
-
food
-
waste.
The ecological footprint is often confused with the carbon footprint. The carbon footprint is the area of forest required to absorb carbon and produce oxygen.
The carbon footprint measures greenhouse gas (GHG) emissions produced by human activities. It is usually calculated in kilograms (kg).
We can calculate the carbon footprint of an object, a person, a family, a country, etc. Several factors are taken into account for this calculation. When calculating the carbon footprint of an object, we consider the greenhouse gases (GHG) emitted during its entire life cycle. This means measuring all the GHGs that were produced to extract the raw materials needed to make the object, then the GHGs produced to manufacture, distribute, use and dispose of the object.
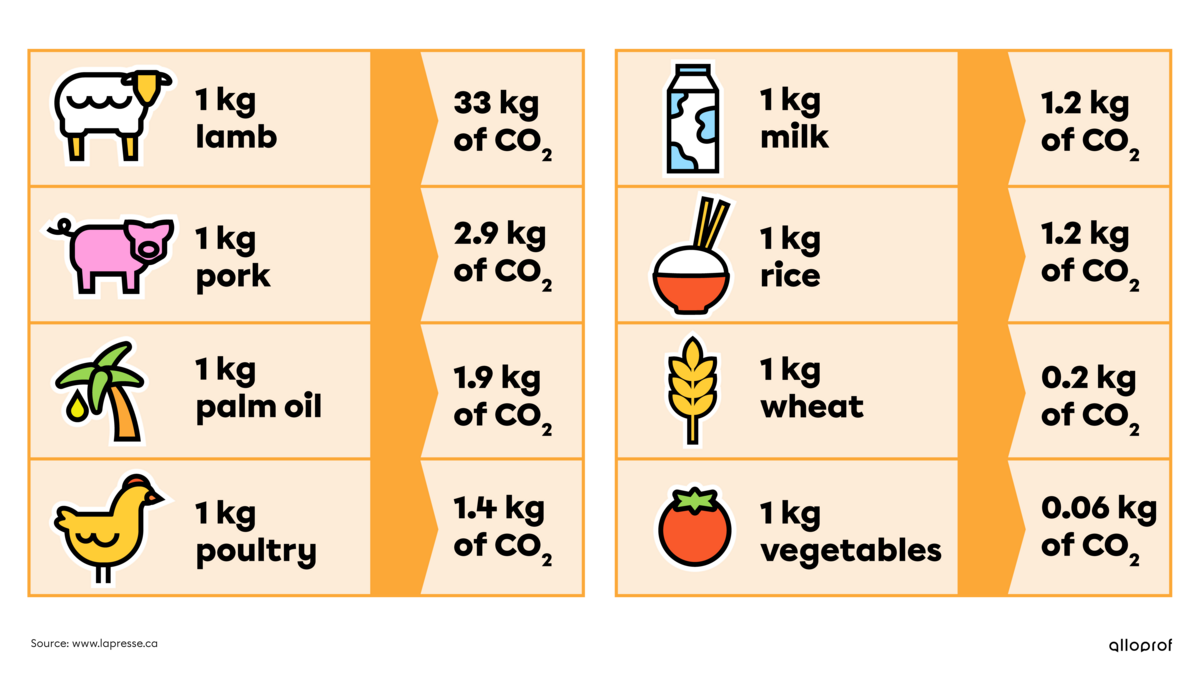
Below is the carbon footprint of the kilogram of meat discussed earlier in this concept sheet. The carbon footprint of one kilogram of beef is 32.5 kg. This means its production (from the animal’s birth until it is sold to the consumer) produces 32.5 kg of CO2. The following table shows the carbon footprint of different food products.
Alloprof. (n.d.). L'empreinte écologique. http://www.alloprof.qc.ca/BV/pages/s1199.aspx
Les cahiers du développement durable. (2020). L’empreinte écologique. http://les.cahiers-developpement-durable.be/outils/empreinte-ecologique/
Deblock, C., Déry, S. Jasmin, É, Rioux, J.-F., Vatz-Laaroussi, M. and Villeneuve, M. (2009). Enjeux. Monde contemporain [Manuel de l’élève]. Éditions ERPI.
Équiterre. (n.d.). Flexitarisme : miam!. http://equiterre.org/geste/flexitarisme-miam
Global Footprint Network. (2020). Compare Countries. Ecological Footprint (gha per person). 2016. https://data.footprintnetwork.org/#/compareCountries?cn=all&type=EFCpc&yr=2016
Gobal Footprint Network. (2019). Ecological Footprint per Person [map]. http://data.footprintnetwork.org/?_ga=2.266597710.1517271952.1594417755-1459196817.1594417755#/
Ladouceur, M. and Parent, A. (2014). Globe [Cahier d’apprentissage]. Chenelière Éducation.
Worldometers. (n.d.). Population mondiale actuelle. https://www.worldometers.info/fr/population-mondiale/
WWF. (2018). Living Planet Report 2018: Aiming higher. https://c402277.ssl.cf1.rackcdn.com/publications/1187/files/original/LPR2018_Full_Report_Spreads.pdf