To sketch the graph of a quadratic (or second-degree polynomial) function, plot a minimum of three points on a Cartesian plane.
The following points are generally sought:
-
The coordinates of the vertex.
-
The coordinates of the zeroes, if they exist.
The |y|-intercept can also be placed along with its symmetrical point (the point on the other branch at the same height).
The points that are found will give a general picture of the parabola. If more precision is required, other points of the function must be found.
Whether in the form |y=ax^2| or |y=a(bx)^2,| the vertex of this function is always located at |(0,0).|
-
Position the function’s vertex at |(0,0).|
-
Build a table of values where the same numbers (in |x|) are used: taking both the number’s positive and negative values. For example, 2 and -2, 3 and -3, etc.
-
Plot the points on a Cartesian plane and sketch the curve of the function.
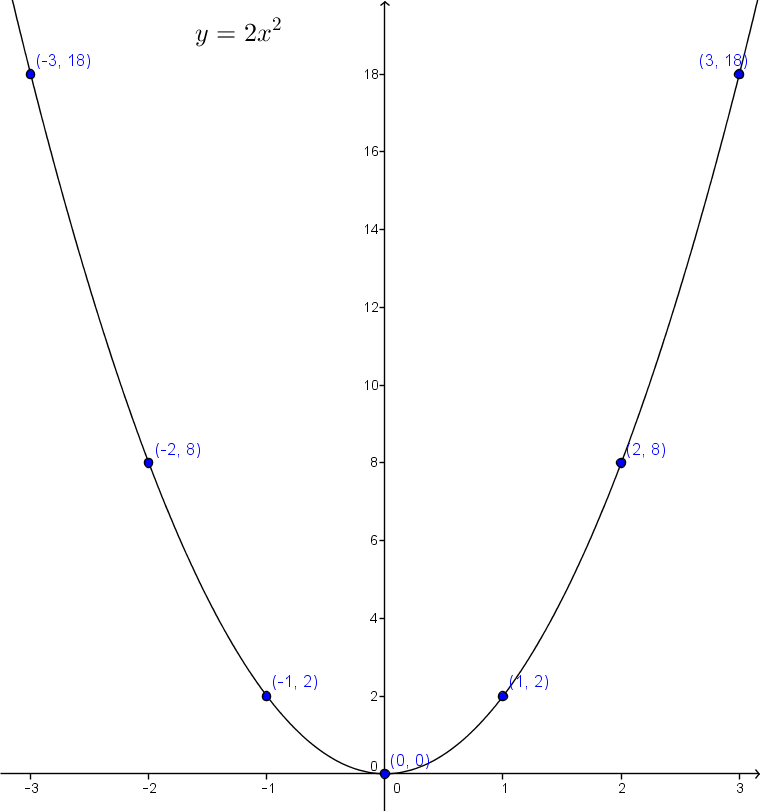
Graph the quadratic function |y=2x^2.|
-
Plot the vertex at |(0,0).|
-
Build a table of values.
|x| |y| |-3| |18| |-2| |8| |-1| |2| |1| |2| |2| |8| |3| |18|
-
Plot the points on a Cartesian plane and sketch the curve of the function.

The procedure is the same whether the function is written in the form |y=ax^2| or |y=a(bx)^2.|
Graphing a quadratic function from its equation in general form takes a little longer than standard form. The general form of the equation is less telling than the standard form. The latter gives the coordinates of the function’s vertex directly, which is crucial for graphing a quadratic function.
-
Find the vertex’s coordinates |(h,k)| of the function by using the formula |\displaystyle (h,k) = \left(- \frac{b}{2a}, \frac{4ac-b^2}{4a} \right).|
-
Find the values of the function’s zeroes by using the quadratic formula. ||\displaystyle x_{1,2}= \frac{-b \pm \sqrt{b^2-4ac}}{2a}||
-
Position the |y|-intercept using the value of |c.| In fact, the coordinates of the intercept are |(0,c).|
-
Find the point on the other branch that is at the same height as the |y|-intercept.
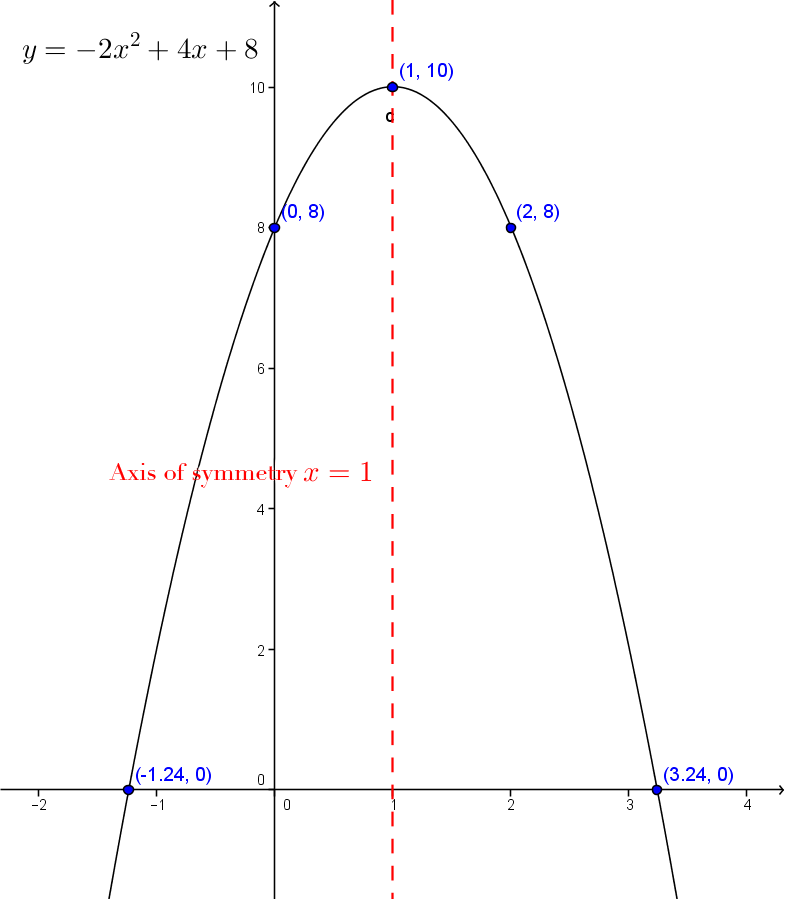
Sketch the graph of the uadratic function |y=-2x^2+4x+8.|
In the function, |a=-2,| |b=4| and |c=8.|
-
The vertex’s coordinates |(h,k)| are calculated as follows.||\begin{align}(h,k) &= \left( - \dfrac{b}{2a}, \dfrac{4ac-b^2}{4a}\right) \\ &= \left(- \dfrac{4}{2 (-2)}, \dfrac{4(-2)(8) - 4^2}{4(-2)} \right) \\ &= (1,10) \end{align}||
-
The zeroes are calculated as follows.||\begin{align} x_{1,2} &=\dfrac{-b \pm \sqrt{b^2-4ac}}{2a} \\ &= \dfrac{-4 \pm \sqrt{4^2 - 4(-2)(8)}}{2(-2)} \\ &= \dfrac{-4 \pm \sqrt{80}}{-2} \end{align}||Next, separate the formula into two parts: one using the + and the other using the -. |x_1| will be a zero and |x_2| will be the other zero.||\begin{align} x_1 &= \dfrac{-4 + \sqrt{80}}{-4} \approx -1{,}24 \\ x_2 &= \frac{-4 - \sqrt{80}}{-4} \approx 3{,}24 \end{align}||Therefore, we have the two points |(-1.24;0)| and |(3.24;0).|
-
Since |c=8,| the point |(0,8)| is obtained.
-
To find the point on the other branch that is at the same height as the |y|-intercept, use the axis of symmetry. The equation is |x=h,| so |x=1.| Therefore, the other point will have the coordinates |(2,8).|
We can now plot the points on a Cartesian plane and graph the function.

-
From the equation of the function, determine the coordinates of the vertex |(h,k).|
-
Find the values of the zeroes of the function by replacing |y| with |0| and isolating |x,| or by using the following formula. ||\displaystyle x_{1,2}= h \pm \sqrt{-\frac{k}{a}}||
-
Calculate the |y|-intercept.
-
Find the point on the other branch that is at the same height as the |y|-intercept.
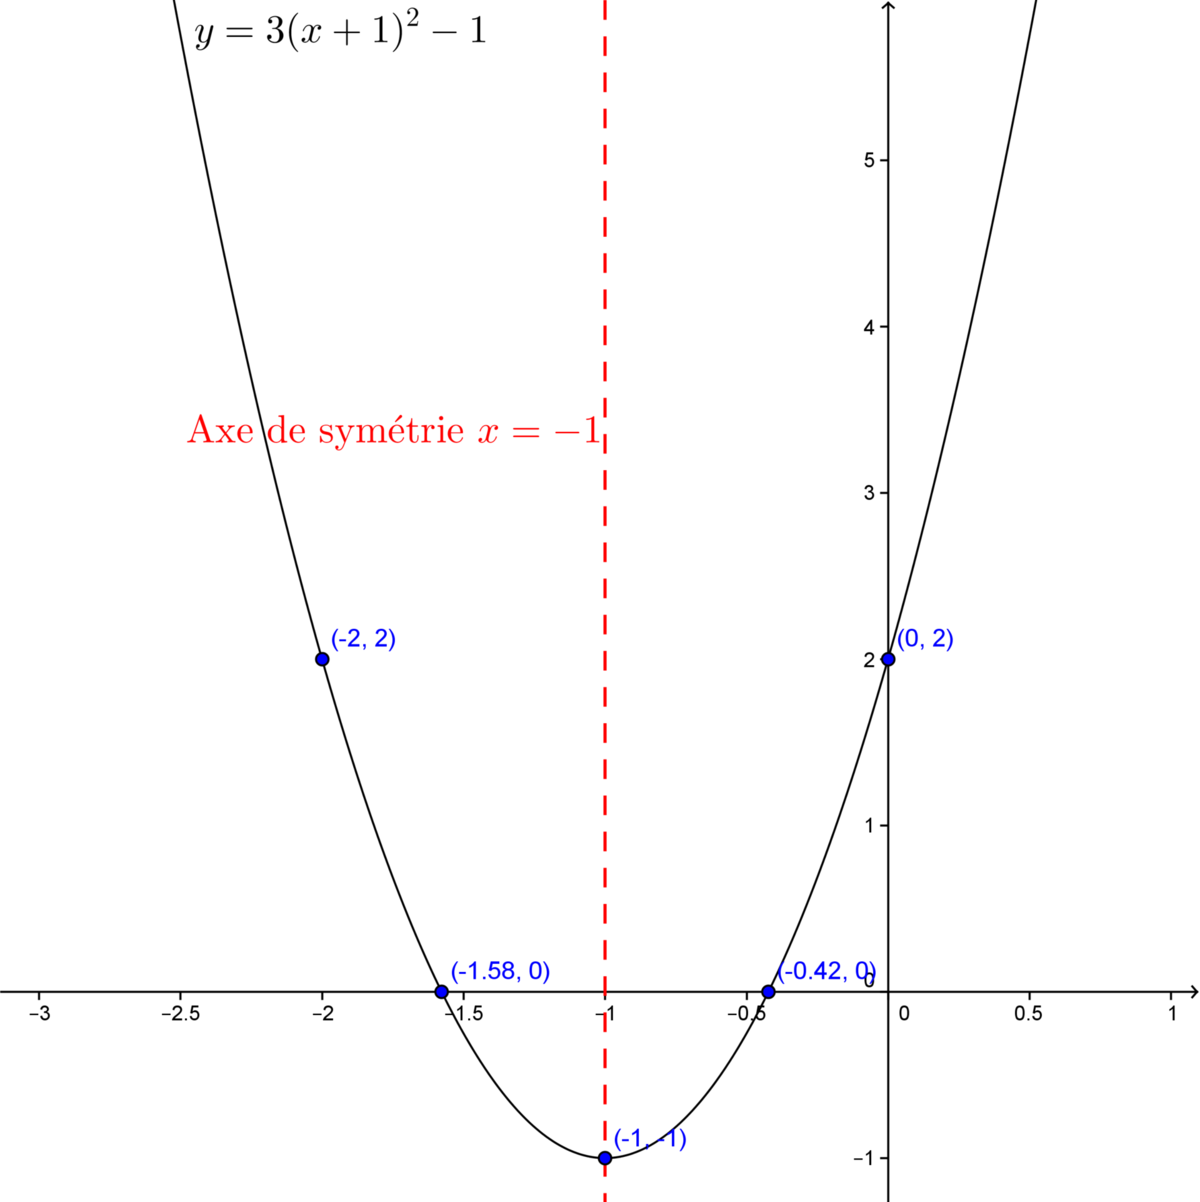
Graph the following quadratic function |y=3(x+1)^2-1.|
-
The vertex’s coordinates of the function are |(-1,-1).| In this case, |a(x-h)^2+k=3(x-(-1))^2-1.|
-
Calculate the zeroes by replacing |y| with |0| and isolating |x|, or by using the formula.||\begin{align} 0 &= 3(x+1)^2 -1 \\ 1 &= 3(x+1)^2 \\ \dfrac{1}{3} &= (x+1)^2 \\ \pm \dfrac{1}{3} &= x+1\quad (\text{ne pas oublier le } \pm) \\ -1 \pm \dfrac{1}{3} &= x \end{align}||Next, separate the formula into two parts: one using the + and the other using the -. |x_1| will be a zero and |x_2| is the other zero.||\begin{align} x_1 &= -1 + \sqrt \frac{1}{3} \approx -0{,}42 \\ x_2 &= -1 - \sqrt \frac{1}{3} \approx -1{,}58 \end{align}||Therefore, the following two points are obtained: |(-0.42,0)| and |(-1.58,0).|
-
The |y|-intercept is calculated by replacing |x| by |0.|||y=3(0+1)^2 - 1 = 2||So, we have the point |(0,2).|
-
The axis of symmetry is |x=h,| in this case |x=-1.| The other point is located at the same height as the |y|-intercept and will have the coordinates |(-2,2).|
Plot the points on a Cartesian plane and graph the parabola.
On peut mettre les points dans un plan cartésien et tracer la fonction.

-
Determine the values of the function’s two zeroes. In the factored form, |y=a(x-x_1)(x-x_2),| where |x_1| and |x_2| are the values of the zeroes.
-
Find the coordinates of the function’s vertex. The vertex’s |x|-value is given by the midpoint formula |\displaystyle h = \frac{x_1 + x_2}{2}|.
To find the |y|-value of the vertex (|k|), replace |x| with the value of |h| in the equation of the function. -
Calculate the |y|-intercept.
-
Find the point on the other branch that is at the same height as the |y|-intercept.
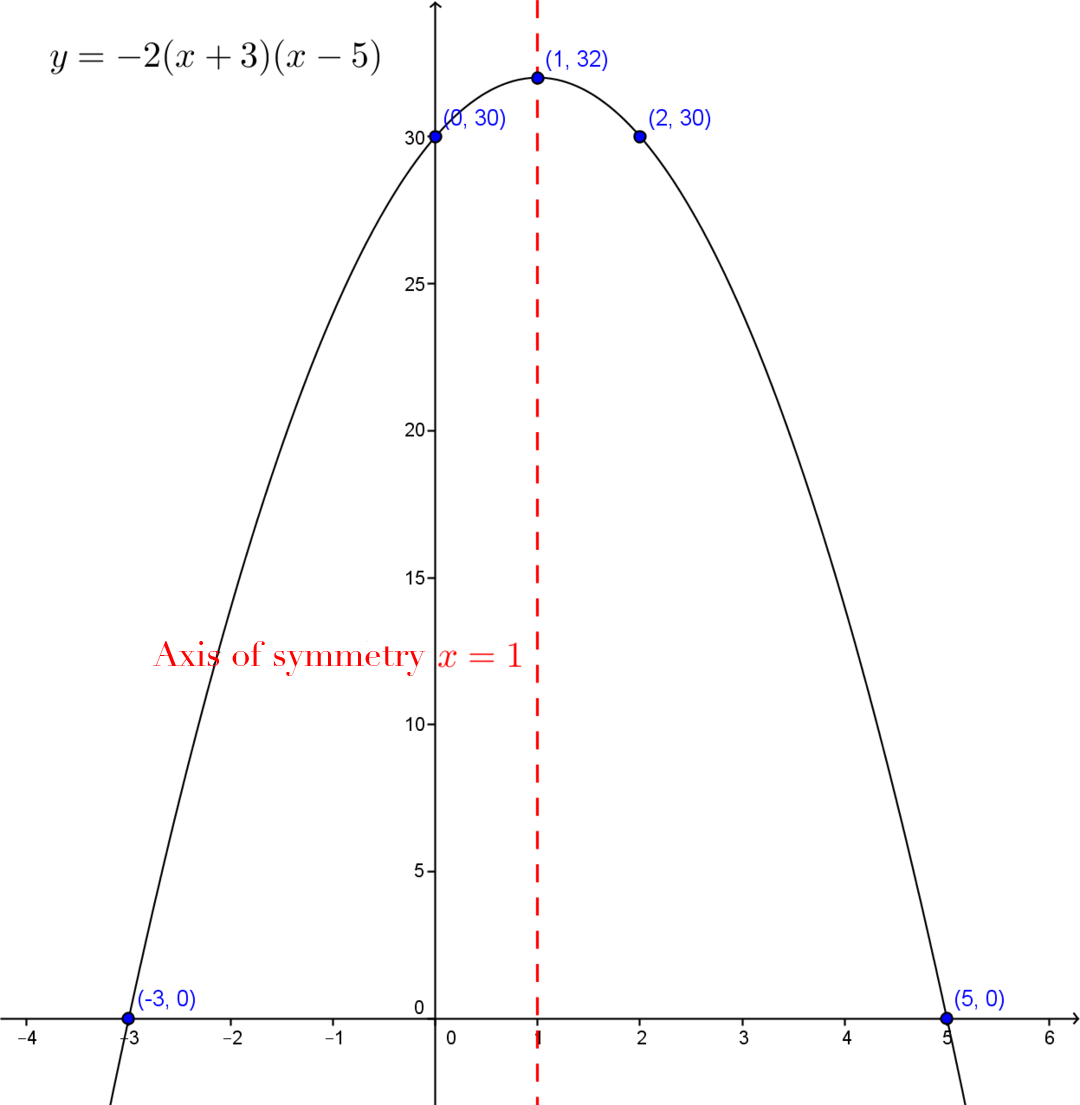
Graph the following quadratic function: |y=-2(x+3)(x-5).|
-
The values of the zeroes are |x_1=-3| and |x_2=5.| In this case, |a(x-x_1)(x-x_2)=a(x-(-3))(x-5).| The points |(-3,0)| and |(5,0)| are obtained.
-
The vertex’s |x|-value t is calculated as follows.||\begin{align} h &= \dfrac{x_1+x_2}{2} \\ &= \dfrac{-3 + 5}{2} \\ &= 1 \end{align}||By replacing |x| with |1| in the equation, the |y|-value of the vertex is obtained, i.e., the value of |k.|||\begin{align} k &= f(h) =f(1)\\ &=-2(1+3)(1-5) \\ &= 32 \end{align}||Therefore, the vertex of the function is at the point |(1,32).|
-
The |y|-intercept is calculated by replacing |x| with |0.|||f(0)=-2(0+3)(0-5) = 30||So, the point |(0,30)| is obtained.
-
The axis of symmetry equation is |x=h|, in this case |x=1.| The other point is located at the same height as the |y|-intercept and has coordinates |(2,30).|
Plot the points on a Cartesian plane and graph the parabola.
