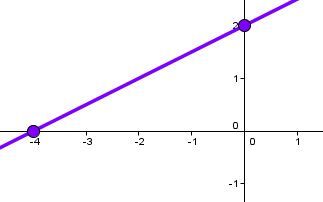
Depending on the form of the equation, the procedure for graphing a line on a Cartesian plane differs.
The methodology behind each form of the equation is described below. However, regardless of the form of equation used, it is always possible to graph a straight line using a table of values calculated from the equation.
Sometimes we don't know the equation of the line. We can still graph it if we are given the coordinates of one point and the value of the slope (parameter |a|). In this case, you can draw the straight line by following these steps:
-
Plot the given point on the Cartesian plane using its coordinates.
-
Using the value of the slope, other points are placed using the rise over run method, also called the staircase method (the numerator of the slope represents the vertical displacement and the denominator of the slope represents the horizontal displacement).
-
Draw a line through these points.
If the slope provided is a whole number, consider it as the numerator of a fraction with a denominator of 1.
Graph the line that has a slope of |\dfrac{1}{2}| and that passes through point |(-3,-1).|
-
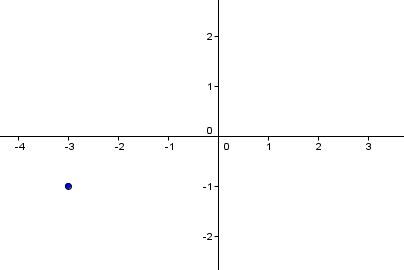
Plot the given point.
-
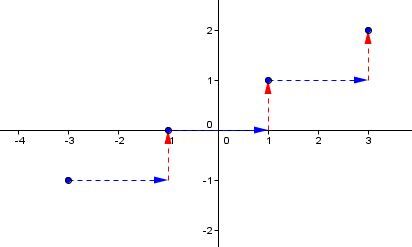
Other points are placed using the value of the slope.
The slope is |\dfrac{1}{2},| which means that we move to the right by 2 units |(x)| and upwards by 1 unit |(y).|
-
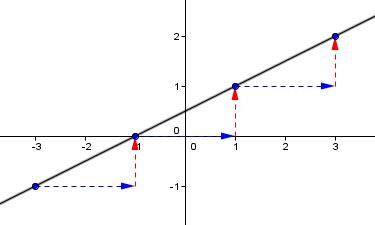
Draw a line through these points.
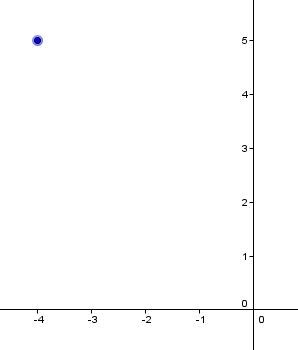
Graph the straight line that has a slope of |-2| and that passes through point |(-4,5).|
-
Plot point |\boldsymbol{(-4,5).}|
-
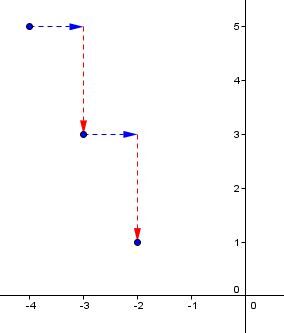
Other points are placed using the value of the slope.
The slope indicates that every time you move 1 unit to the right |(x),| you move 2 units downwards |(y).|
-
Draw a line through these newly plotted points.
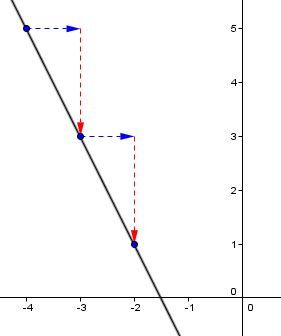
If the value of the slope is unknown but the coordinates of two points are provided, simply plot the two points on the Cartesian plane and connect them using a straight line to draw the graph.
The functional form of the equation of a line is given by |y = ax + b|. A line whose equation is in this form can be graphed using the following steps:
-
Plot the y-intercept (which corresponds to the value of parameter |b|) on the Cartesian plane.
-
Starting from the y-intercept, plot another point using the slope of the line (the value of parameter |a|).
-
Draw the line that passes through these 2 points.
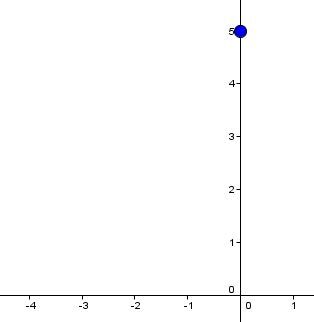
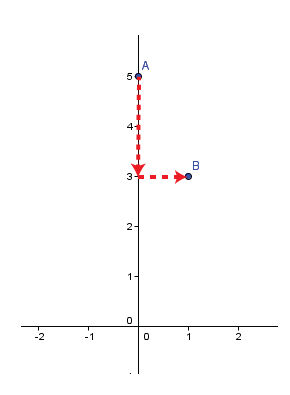
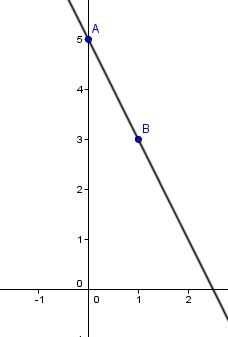
Consider the equation |y = -2x + 5.|
-
Plot the y-intercept |\boldsymbol{(b = 5)}| on the Cartesian plane.
-
From this point, use the slope |\boldsymbol{(a = -2)}| to plot a second point on the Cartesian plane.
-
Draw the line that passes through these 2 points.
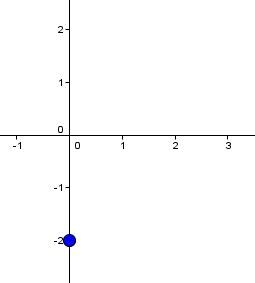
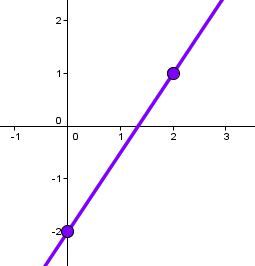
Consider the equation |y = \dfrac{3}{2}x - 2.|
-
Plot the y-intercept |\boldsymbol{(b = -2)}| on the Cartesian plane.
-
From this point, use the slope |\boldsymbol{\left(a = \dfrac{3}{2}\right)}| to plot a second point on the Cartesian plane.

-
Draw the line that passes through these 2 points.
The symmetrical form of the equation of a line is written |\dfrac{x}{\text{a}} + \dfrac{y}{b} = 1.| A line whose equation is in this form can be graphed using the following steps:
-
Plot the y-intercept (corresponding to the value of parameter |b|) and the x-intercept (corresponding to the value of parameter |\text{a}|) on the Cartesian plane.
-
Draw the line that passes through these 2 points.
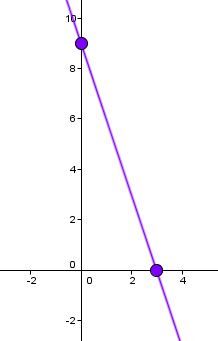
Consider the equation |\dfrac{x}{3} + \dfrac{y}{9} = 1.|
-
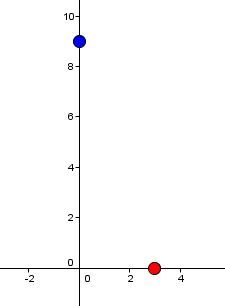
Plot the y-intercept and the x-intercept.
The y-intercept is equal to |\color{#333fb1}{b = 9}| and the x-intercept is equal to |\color{#ec0000}{\text{a} = 3}.| Plot these 2 points on the Cartesian plane.
-
Draw the line that passes through these 2 points.
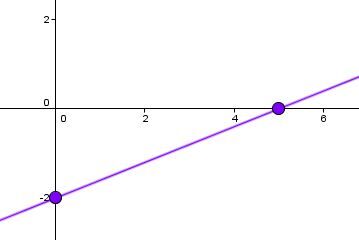
Consider the equation |\dfrac{x}{5} - \dfrac{y}{2} = 1.|
-
Plot the y-intercept and the x-intercept.
The y-intercept is equal to |\color{#333fb1}{b = -2}| and the x-intercept is equal to |\color{#ec0000}{\text{a} = 5}.| Plot these 2 points on the Cartesian plane.

-
Draw the line that passes through these 2 points.
The general form of the equation of a line is written |Ax + By + C = 0.| A line whose equation is in this form can be graphed using the following steps:
-
Determine the value of the y-intercept of the line by calculating the value of |y| when |x=0.|
-
Determine the value of the x-intercept of the line by calculating the value of |x| when |y=0.|
-
Plot these 2 points on a Cartesian plane.
-
Draw the line that passes through these 2 points.
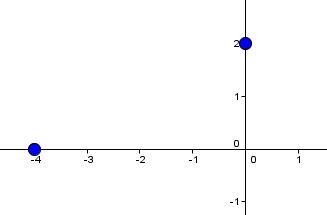
Consider the equation |4x - 8y + 16 = 0.|
-
Determine the value of the y-intercept.||\begin{align}4(0) - 8y + 16 &= 0\\-8y &= -16\\y &= 2\end{align}||
-
Determine the value of the x-intercept.||\begin{align}4x - 8(0) + 16 &= 0\\4x &= -16\\x &= -4\end{align}||
-
Plot these 2 points on a Cartesian plane.
-
Draw the line that passes through these 2 points.
