There are many properties related to the various functions.
The domain of a function |f| corresponds to the set of values that its independent variable, generally |x,| can take.
The domain of a function can be given in different ways: sets of numbers, intervals, and brackets.
What is the domain of the function |f(x)=12x-1|? The function is plotted as follows.
Quel est le domaine de la fonction |f(x)=12x-1|? Cette fonction a pour graphique :
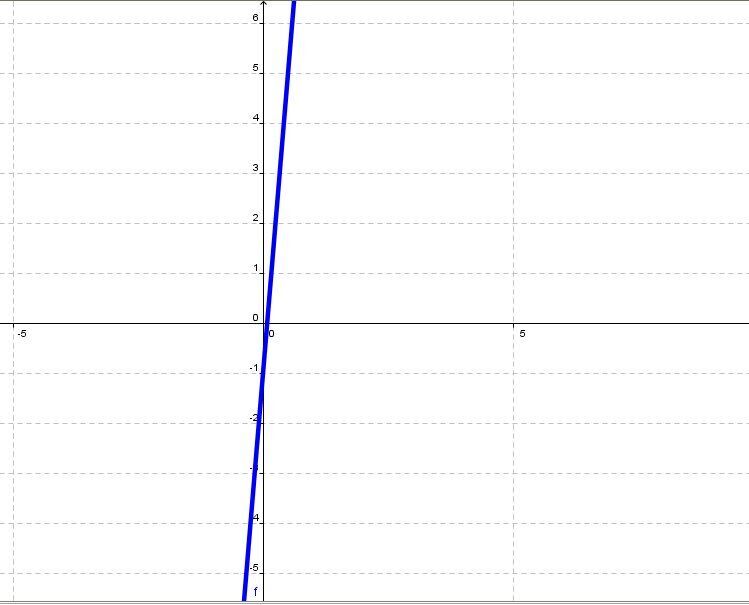
Le domaine de cette fonction est formé de tous les nombres réels, car les valeurs que la variable |x| peut prendre sont comprises entre l’infini négatif et l’infini positif.
En langage mathématique, on peut écrire le domaine des 3 façons suivantes :||\begin{align}\text{dom}(f)&=\mathbb{R}\\&\ \text{ou}\\\text{dom}(f)&=\; ]-\infty,+\infty[\\&\ \text{ou}\\\text{dom}(f)&=\{x\in\mathbb{R}\}\end{align}||
Instead of writing the interval |]-\infty,+\infty[,| we simply write |\mathbb{R}.|
The range of a function |f| corresponds to the set of values the dependent variable, generally |y,| can take.
It is possible to confuse the concepts of range and codomain by considering them synonymous with each other. However, that is not always the case.
The range of a function is defined as a subset of the codomain. In other words, the range is not necessarily equivalent to the codomain.
The range of a function can be expressed in different ways: number sets, intervals, and brackets.
What is the range of the function |f(x)=12x-1|? Here is the function’s graph.
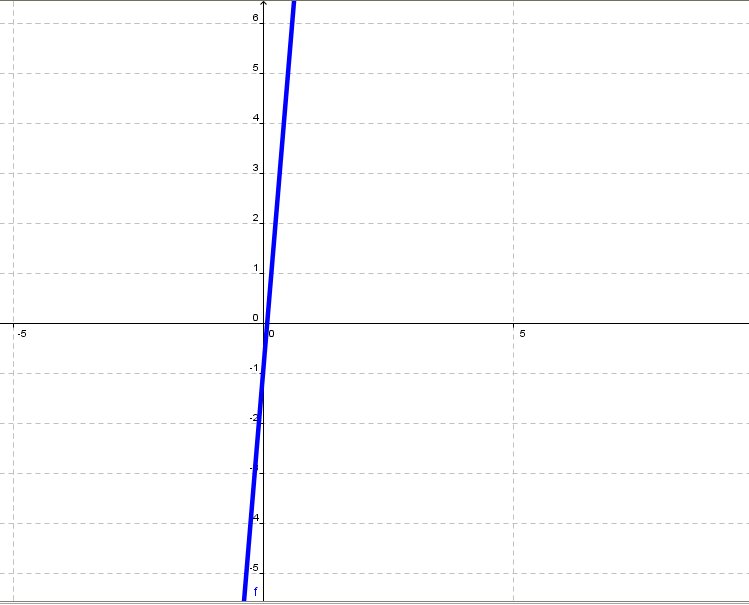
The function’s range is formed by all the real numbers because the values the variable |y| can have are all of the values between negative and positive infinity. In mathematical language, the range can be written in the following ways:||\begin{align} \text{ran}(f)&=\mathbb{R}\\ &\ \text{or}\\ \text{ran}(f)&=\; ]-\infty,+\infty[\\ &\ \text{or}\\ \text{ran}(f)&=\{f(x)\in\mathbb{R}\} \end{align}||
The variation of a function is expressed in terms of increase, decrease, and constancy.
-
We speak of increase when, over a given function’s domain, the range of the function does not decrease. Therefore, the increase corresponds to an interval in |x| where the values of |y| do not decrease; the values of |y| increase or remain constant.
-
We speak of decrease when, over a given function’s domain, the range of the function does not increase. Therefore, the decrease corresponds to an interval in |x| where the values of |y| do not increase; the values of |y| decrease or remain constant.
-
We say that a function is constant (null variation) if, for a given domain interval, the |y|-values remain unchanged.
A function is strictly increasing over an interval of |x| if and only if the values of |y| are always increasing.
A function is strictly decreasing over an interval of |x| if and only if the values of |y| are always decreasing.
We read the variation of a function on a graph from left to right.
Consider the following graph.
The function is increasing over the interval |[0,4].| It is strictly increasing over the interval |[0,2].|
The function is decreasing over the interval |[2,8].| It is strictly decreasing over the interval |[4,8].|
The function is constant over the interval |[2,4].|
The interval |[2,4]| is included in both increase and decrease. Over this interval, the function has no variation. This interval is removed from the increase and decrease when we speak of strict increase and strict decrease.
The extremes of a function are the maximum and the minimum of a function.
The maximum of a function corresponds to the maximum value of its range, i.e., its maximum value of |y.|
The minimum of a function corresponds to the minimum value of its range, i.e., its minimum value of |y.|
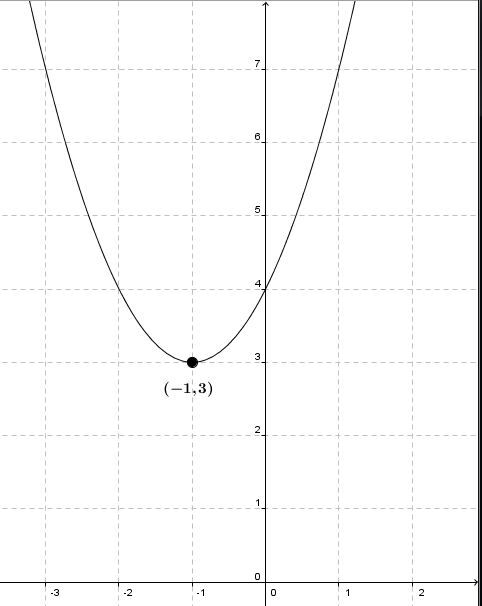
In the graph above, the minimum is |3.|
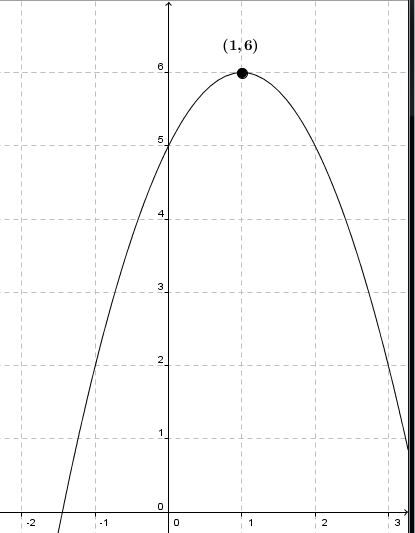
In the graph above, the maximum is |6.|
It is possible that a function has just one, two, or no extremes.
To determine the function’s sign, look at the values of the function’s intercepts.
-
A function |f(x)| is positive over a given interval in |x| if, over the interval, the values of |f(x)| are greater than or equal to |0| (positive).
-
A function |f(x)| is negative over a given interval in |x| if, over the interval, the values of |f(x)| are less than or equal to |0| (negative).
Consider the following graph.
The function is positive over the interval |[-3,+\infty[.|
The function is strictly positive over the interval |]0,+\infty[.|
The function is negative on the interval |]-\infty,0].|
The function is strictly negative on the interval |]-\infty,-3[.|
The |x|-intercept of a function is the |x|-value of the point that is directly on the |x|-axis. In other words, the coordinates of the point related to the |x|-axis can be written in the form |(x,0).| This is also referred to as the function’s zero.
The |y|-intercept of a function is the |y|-value of the point that is directly on the |y|-axis. Consequently, the coordinates of such a point are written |(0,y).| This is also referred to as the initial value of the function.
Consider the following graph.
The |x|-intercept of the function is |-3.|
The |y|-intercept of the function is |3.|
A function can only have one |y|-intercept. Sometimes, there may not be one, but there can never be more than one.
A function can have many, one, or no |x|-intercepts.
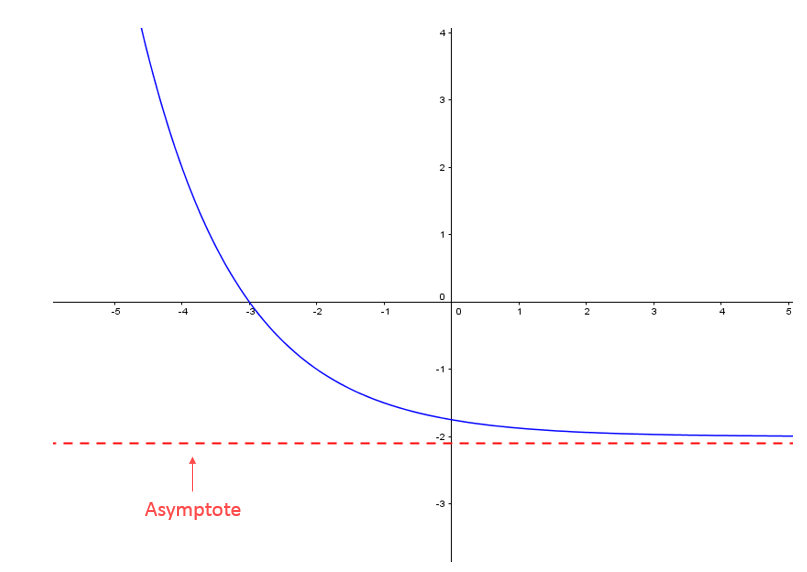
An asymptote, often represented by a dotted line on a graph, is a straight line that a function approaches more and more, without ever touching it. There can be several asymptotes for the same function.
Below is an example of a function with two asymptotes.
The following function has only one asymptote.
To confirm you understand functions, see the following interactive CrashLesson:
