The relationship between position and time in the UARM is described by a quadratic relationship in which the change in position progressively increases as time passes.
To observe this relationship, it is convenient to graph data about the position of an object according to time.
Here is the movement of a car according to time.
| Movement of a Car According to Time | |
|---|---|
|
Time |\text {(s)}| |
Movement |\text {(m)}| |
|
|0| |
|0| |
|
|10| |
|25| |
|
|20| |
|100| |
|
|30| |
|225| |
|
|40| |
|400| |
|
|50| |
|625| |
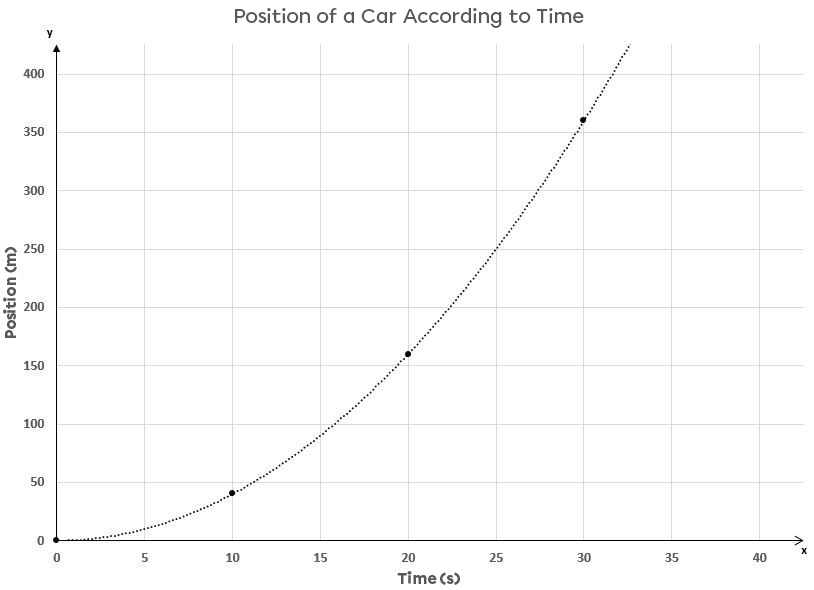
The movement of the car according to time can be illustrated as in the graph below.

The relation obtained is a curve, which means that the variation of position is increasingly large for each time interval.
Even if the graphical relationship is not a line, by calculating the slope, we would still be able to calculate the speed of the car. By drawing two points from the graph, it would be possible to determine the average speed, while by drawing the tangent of the curve at a given point, we would obtain the instantaneous speed.
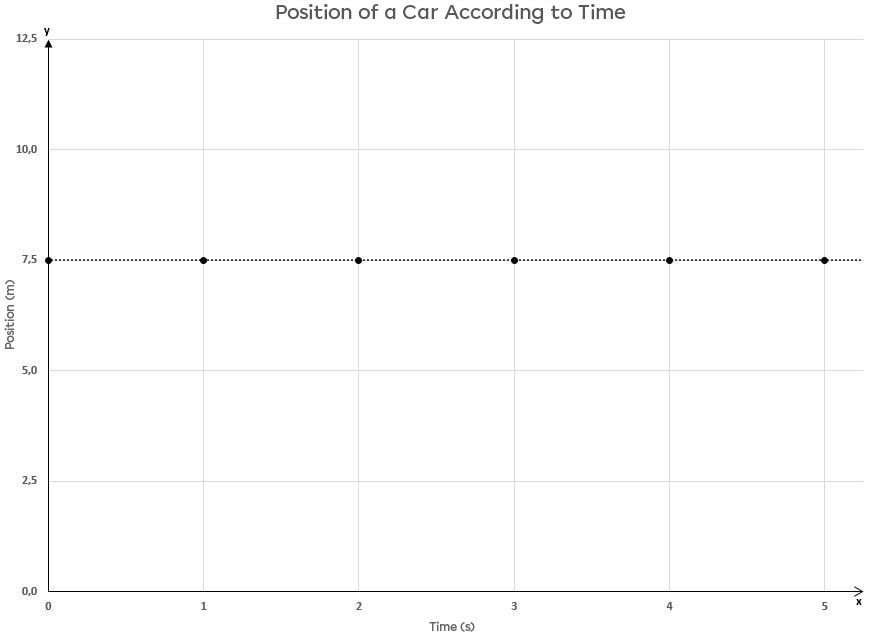
A graph with a null relationship is neither a URM (uniform rectilinear motion) nor a UARM. A horizontal line means that the studied object is not in motion: it is stationary.

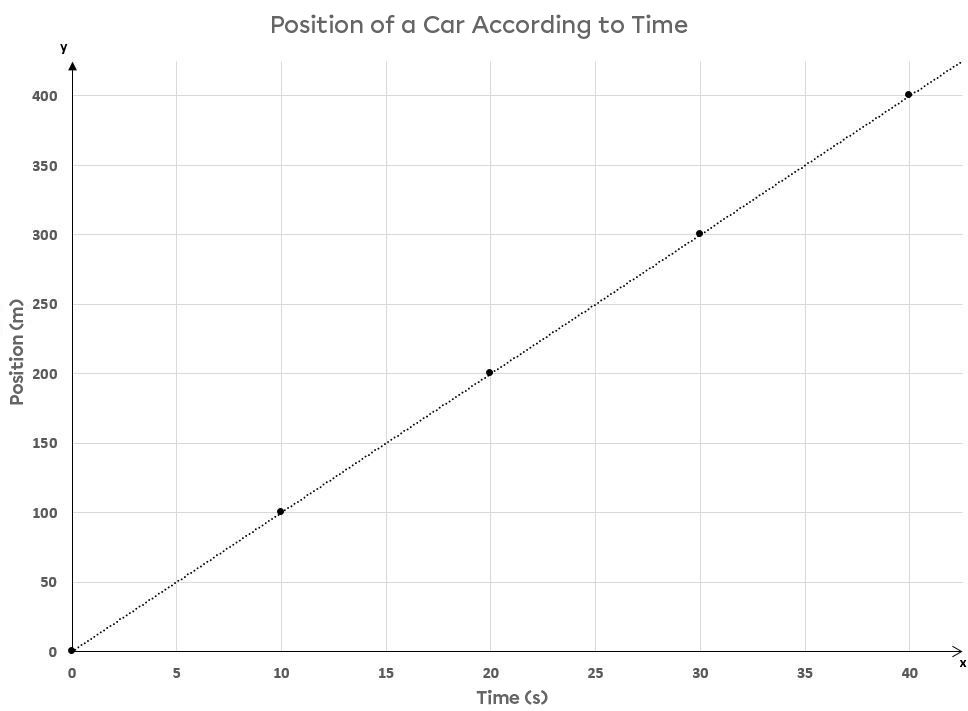
In addition, a graph showing a linear relationship is not a UARM. This type of graph is characteristic of URM.

Pour valider ta compréhension à propos du MRUA de façon interactive, consulte la MiniRécup suivante :

The relationship between position and time in UARM is different from the relationship between position and time in URM.