The relationship between position and time in the MRU is described by a linear relationship in which the variation in position over a given time interval is constant.
To observe this relationship, it's handy to plot data on the position of an object as a function of time.
The following example shows the displacement of a car as a function of time.
Car travel as a function of time
|
Time |small \text {(s)}| |
Displacement |small \text {(m)}| |
| 0 | 0 |
| 10 | 100 |
| 20 | 200 |
| 30 | 300 |
| 40 | 400 |
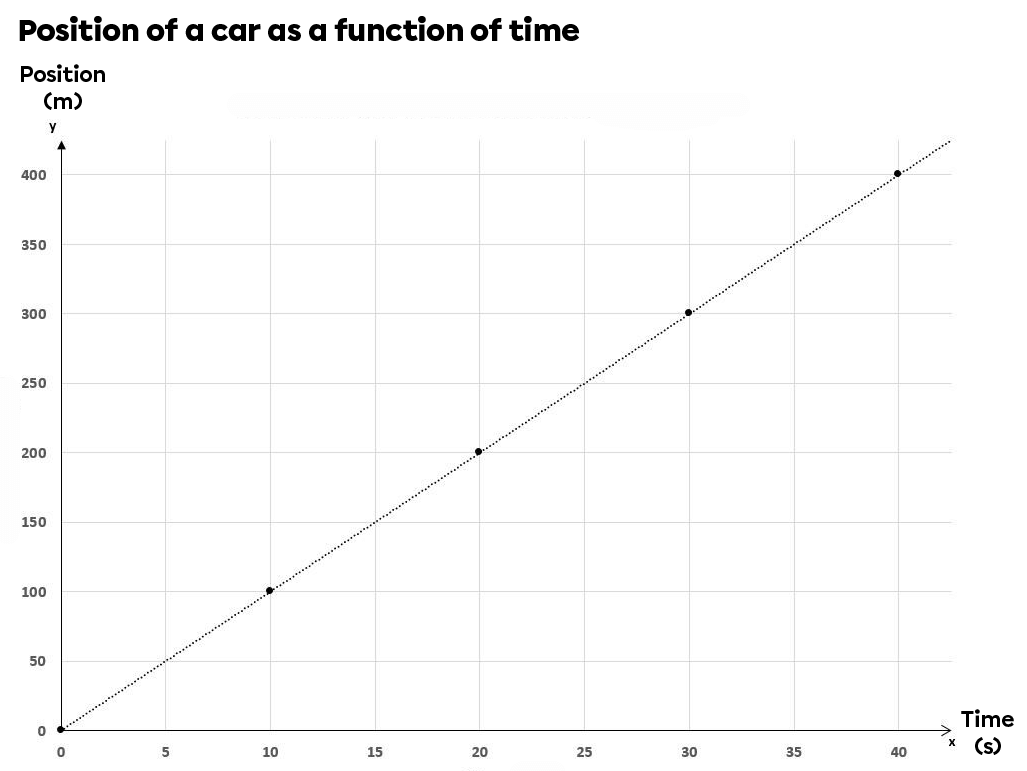
The graph below shows the car's displacement as a function of time.

The resulting relationship is a linear straight line, which means, as mentioned earlier, that the change in position is the same for each time interval.
The slope of this line can be calculated in the same way as in any mathematical graph. Calculating this slope will help determine the car's speed.
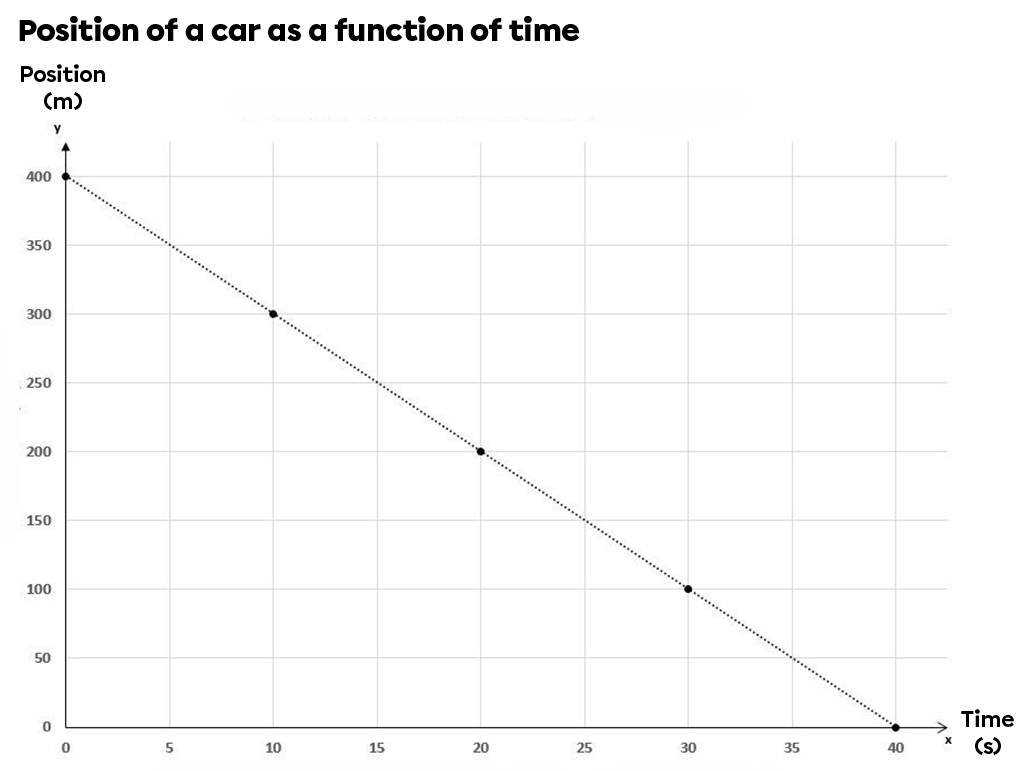
The relationship described above is also possible when the slope of the graph is negative. Let's assume that the car takes the opposite path to the one described above.
Car travel as a function of time
|
Temps |\small \stext {(s)}| |
Displacement |small \text {(m)}| |
| 0 | 400 |
| 10 | 300 |
| 20 | 200 |
| 30 | 100 |
| 40 | 0 |
The graph below shows the car's displacement as a function of time.

The resulting relationship is a linear line, but with a negative slope. It's important to remember that the negative sign means that the displacement is in the opposite direction to the reference system.
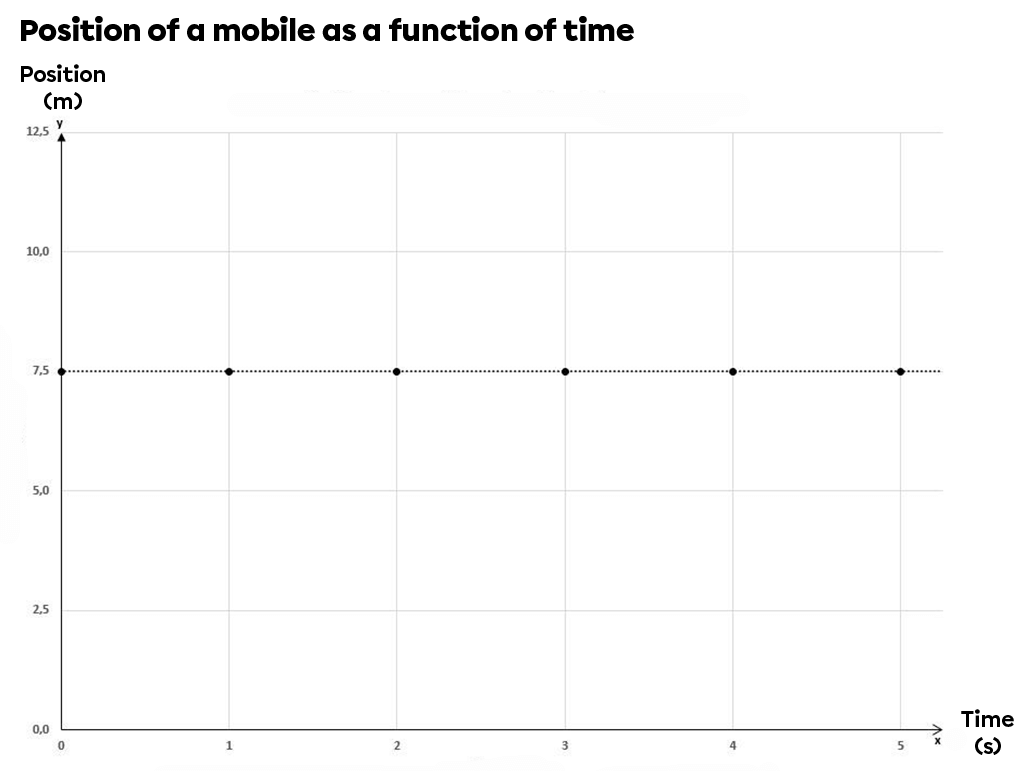
A graph with a zero relationship is neither an MRU nor an MRUA. A horizontal line means that the object studied is not in motion: it is stationary.

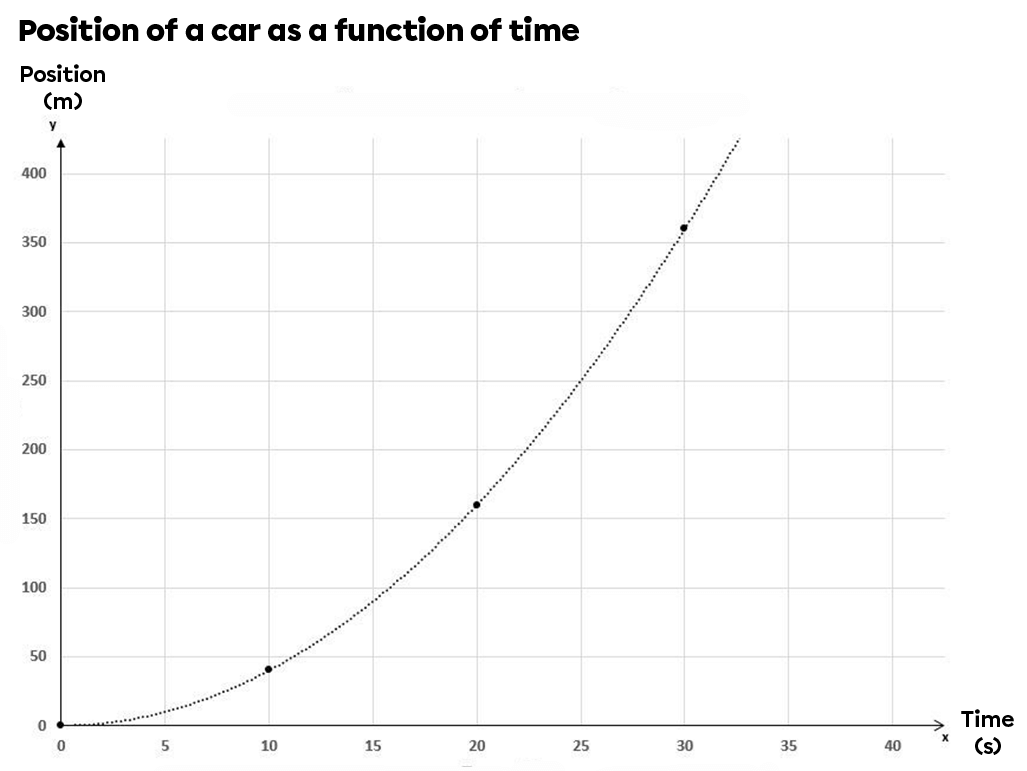
What's more, a graph showing a quadratic relationship is not a MRU. This type of graph is characteristic of MRUA.

The relationship between position and time in the MRU is distinct from the relationship between position and time in the MRUA.