The energy diagram of a transformation is a graph that shows the different energy levels of the substances present according to the progress of the transformation.
An energy diagram can be used to illustrate the course of a chemical reaction. This diagram helps to visualize the energy difference between the reactants and the products involved in a reaction. It also illustrates the increase in energy as the activated complex is formed. The progression of the energy level throughout the reaction can therefore be followed.
An energy diagram is used to calculate an enthalpy change occurring during a chemical reaction. For this purpose, the energy diagram contains a curve with three distinct levels. The enthalpy level of the reactants (in kJ/mol) is to the left of the graph while that of the products is to the right. The enthalpy increase occurring with the formation of the activated complex is illustrated in the centre of the graph; this corresponds to the activation energy.
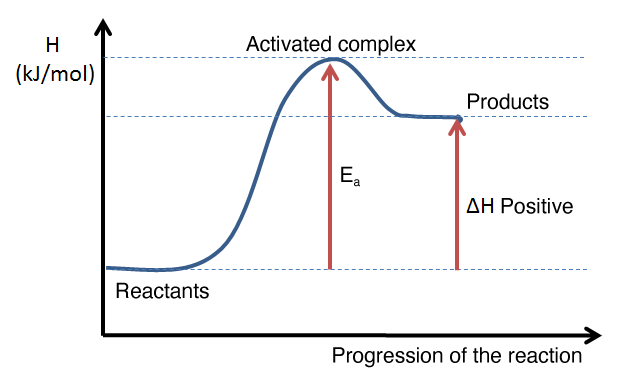
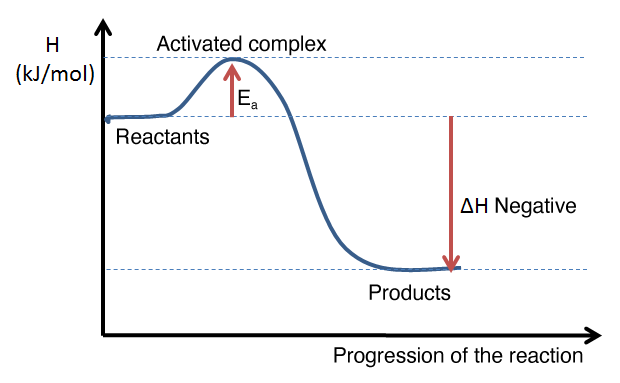
The following graphs illustrate the appearance of an energy diagram for an endothermic reaction (left) and an exothermic reaction (right).
The interpretation of an energy diagram is used to determine whether a reaction is exothermic or endothermic, either by the general shape of the curve or by calculating the enthalpy change of the reaction. From an energy diagram, it is also possible to assess the magnitude of the activation energy of a reaction and to compare the direct and reverse reactions.
It is possible to determine whether a reaction absorbs or releases energy by observing the general shape of the curve. For this purpose, a vertical arrow must be drawn from the enthalpy level of the reactants to the enthalpy level of the products.
-
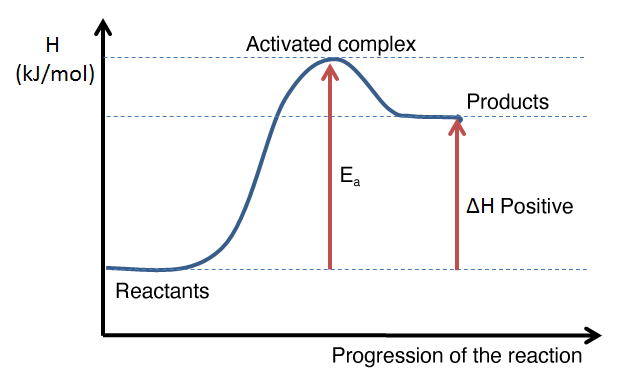
If the arrow points upwards, it means that the enthalpy change is positive, that energy is absorbed, and therefore that the reaction is endothermic.
-
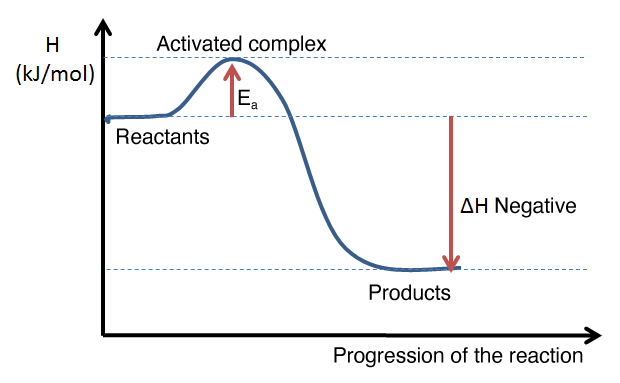
If the arrow points downwards, it means that the enthalpy change is negative, that energy is released, and therefore that the reaction is exothermic.
Example of an energy diagram for an endothermic reaction: the enthalpy level of the products is higher than that of the reactants. The enthalpy change is therefore positive.
Example of an energy diagram for an exothermic reaction: the enthalpy level of the products is lower than that of the reactants. The enthalpy change is therefore negative.
It is possible to determine whether a reaction absorbs or releases energy by calculating the enthalpy change of the reaction. The energy diagram usually shows the energy value of reactants and products on the |y|-axis.
To determine the enthalpy change, simply subtract the enthalpy of the reactants from the enthalpy of the products. If the value is positive, the reaction is endothermic, whereas if the value is negative, it is exothermic.
The following mathematical formula is used to determine the enthalpy change.
ΔH=Hp−Hr
If the value obtained is positive, the reaction is endothermic.
If the value obtained is negative, the reaction is exothermic.
It is possible to assess the magnitude of the activation energy of a reaction. The activation energy is different for each reaction. The higher the activation energy, the slower the reaction proceeds. Conversely, the lower the activation energy, the faster the reaction.
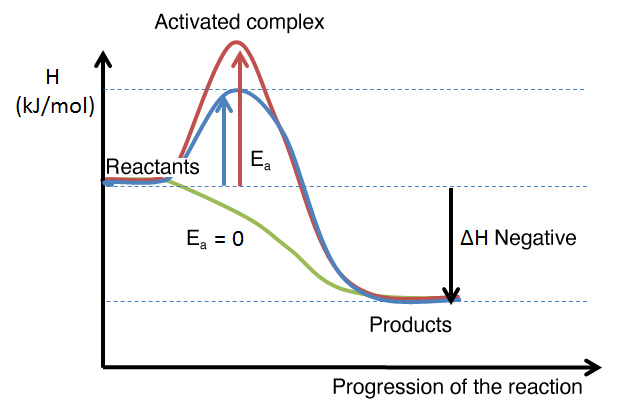
The activation energy can sometimes be very low, or even practically zero. When the reactant molecules have enough energy to break through the activation energy barrier without needing to provide more energy, the reaction is a spontaneous reaction. The case of zero activation energy is theoretical, since the formation of an activated complex always involves an energy demand.
The energy diagram below shows the enthalpy change for different reactions. The enthalpy change is identical for the three reactions. However, the activation energy required to initiate the reaction changes. It is high in the reaction in red, average in the blue one, and zero in the green curve. We can therefore say that the reaction in red is relatively slow, whereas the reaction in green would be spontaneous.
-
A direct reaction, or forward reaction, takes place when the reactants turn into products.
-
A reverse reaction takes place when the products turn into reactants.
Most reactions are irreversible, that is they can only occur in one direction. This is the case for all reactions involving combustion.
Some chemical reactions can occur in both directions, in their direct and reverse directions. These are called reversible reactions.
The decomposition of water is the reverse reaction of the synthesis of water.
Decomposition of water
2H2O(g)+488kJ→2H2(g)+O2(g)
Synthesis of water
2H2(g)+O2(g)→2H2O(g)+488kJ
To reverse a reaction, the reactants and the products need only to be interchanged. Also, the reverse reaction of an endothermic reaction will be exothermic, and vice versa. Although this can be done, it is not necessary to draw a new energy diagram to interpret the reverse reaction. As the energy diagram of the direct reaction is read from left to right, simply interpret it from right to left to quantify the reverse reaction.
The diagram is read from left to right for the synthesis of water and from right to left for the decomposition of water.
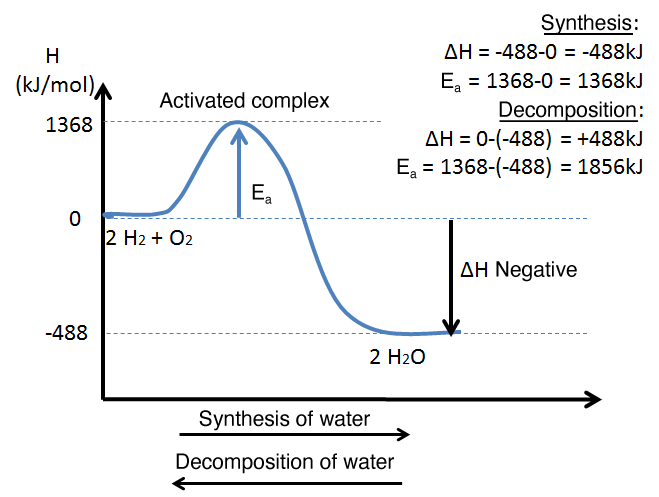
The activation energy is not the same in both directions of a reaction. However, the enthalpy change is the same in absolute value, as the enthalpies of the reactants and products are simply reversed.