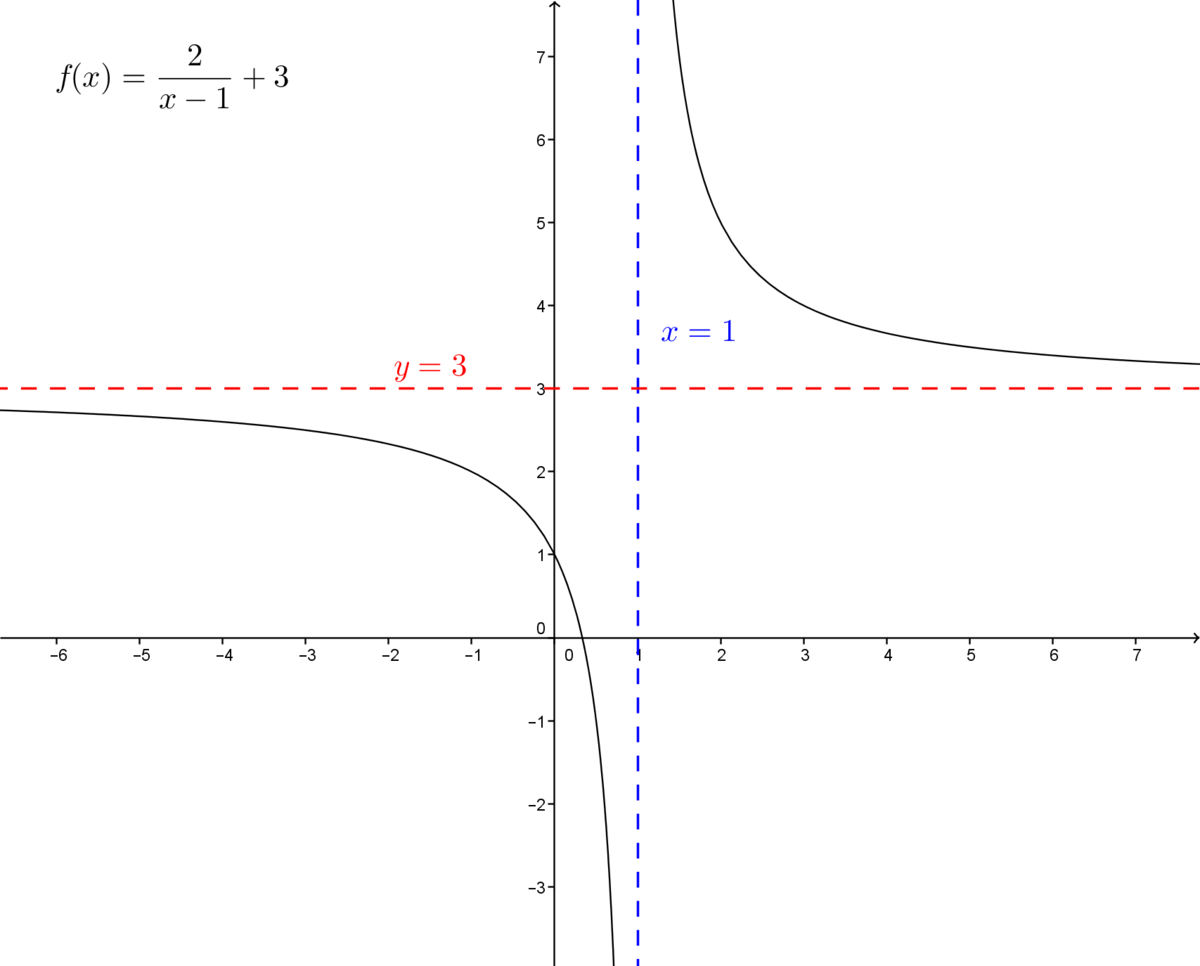
Adding the parameters |a,| |b,| |h,| and |k| to the basic function |f(x)=\displaystyle \frac{1}{x}| results in what is called the standard form (also called the transformed form) of the rational function (sometimes referred to as a reciprocal function).
The standard form of the rational function is ||f(x) = \displaystyle \frac{a}{b(x-h)}+k|| where |a,| |b,| |h,| and |k| are real numbers that act as parameters.
Note: The parameters |a| and |b| must be non-zero.
It is possible to express the equation of a transformed rational function using only three parameters. The equation of the rational function can be converted as follows. ||\begin{align}f(x) &= \dfrac{\color{red}{a}}{\color{orange}{b}(x-\color{blue}{h})}+\color{green}{k}\\\\f(x) &= \dfrac{\dfrac{\color{red}{a}}{\color{orange}{b}}}{(x-\color{blue}{h})}+\color{green}{k}\\\\f(x) &= \dfrac{\color{salmon}{A}}{(x-\color{blue}{h})}+\color{green}{k}\\\\ \end{align}||
Experiment with the values of parameters |a,| |b,| |h,| and |k| in the following interactive animation to see how they affect the rational function. Observe the changes which take place on the transformed curve (in black) compared to the base function (in blue). Notice the effect of modifying the parameters on the properties of the function. Afterwards, read the concept sheet to learn more about each of the parameters.
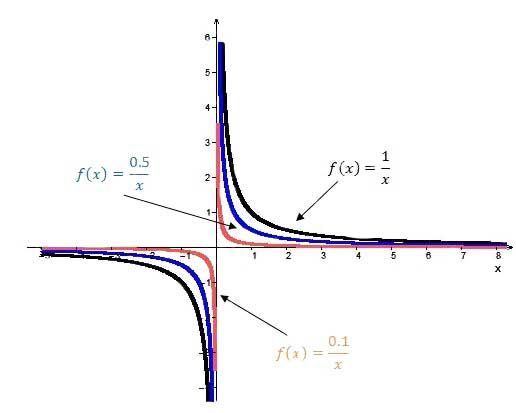
When |{\mid}a{\mid} >1|
The larger the absolute value of the parameter |a|, the farther away the curve of the rational function is from its asymptotes.

When |0< {\mid}a{\mid} <1|
The smaller (closer to |0|) the absolute value of the parameter |a|, the closer the curve of the rational function is to its asymptotes.
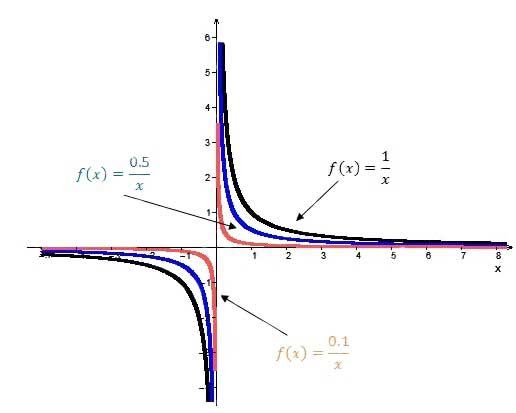
When |{\mid}b{\mid} >1|
The larger the absolute value of the parameter |b|, the closer the curve is to its asymptotes.

When |0< {\mid}b{\mid} <1|
The smaller (nearer |0|) the absolute value of the parameter |b|, the farther away the curve is from its asymptotes.
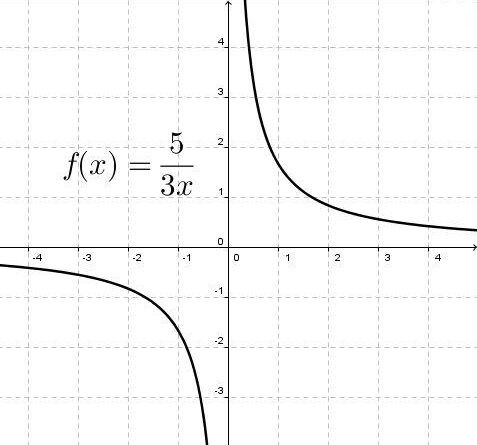
The parameters |a| and |b| are also responsible for the orientation of the graph.
When |a| and |b| have the same sign |(ab>0)|
The function decreases over the two intervals of its domain. The two branches of the hyperbola lie in the first and third quadrant.
When |a| and |b| have opposite signs |(ab<0)|
The function increases over the two intervals of its domain. The two branches of the hyperbola lie in the second and fourth quadrant.
When |h| is positive |(h>0)|
The curve of the rational function moves to the right.
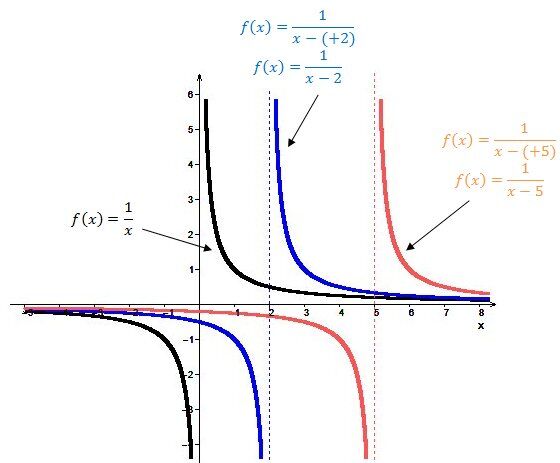
When |h| is negative |(h<0)|
The curve of the rational function moves to the left.
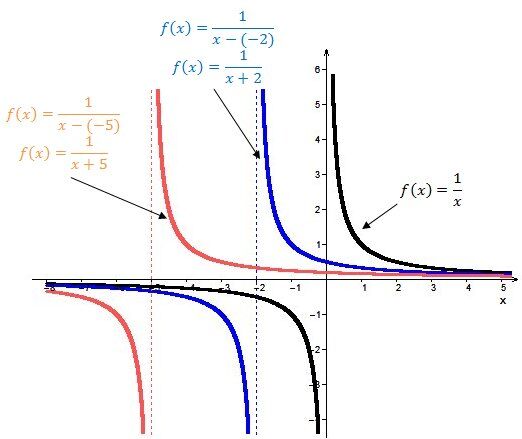
When |k| is positive |(k>0)|
The curve of the rational function moves upwards.
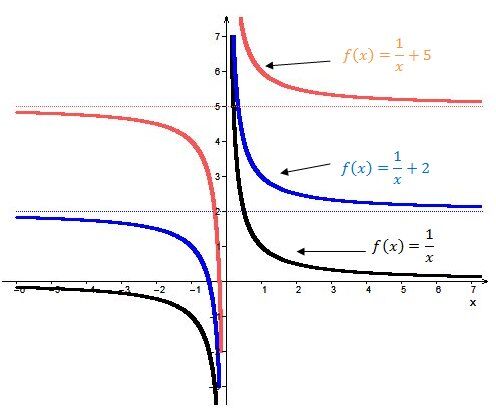
When |k| is negative |(k<0)|
The curve of the rational function moves downward.

The asymptotes of a rational function have the equations |x=h| and |y=k.|
In the following graph, the asymptotes are represented by a dotted line.
