The position of a moving body represents its relative location to a reference system.
We usually place the origin as the starting point of a moving body's motion and then determine its relative position from this point.
From a graphical point of view, three types of relationships can be obtained:
|
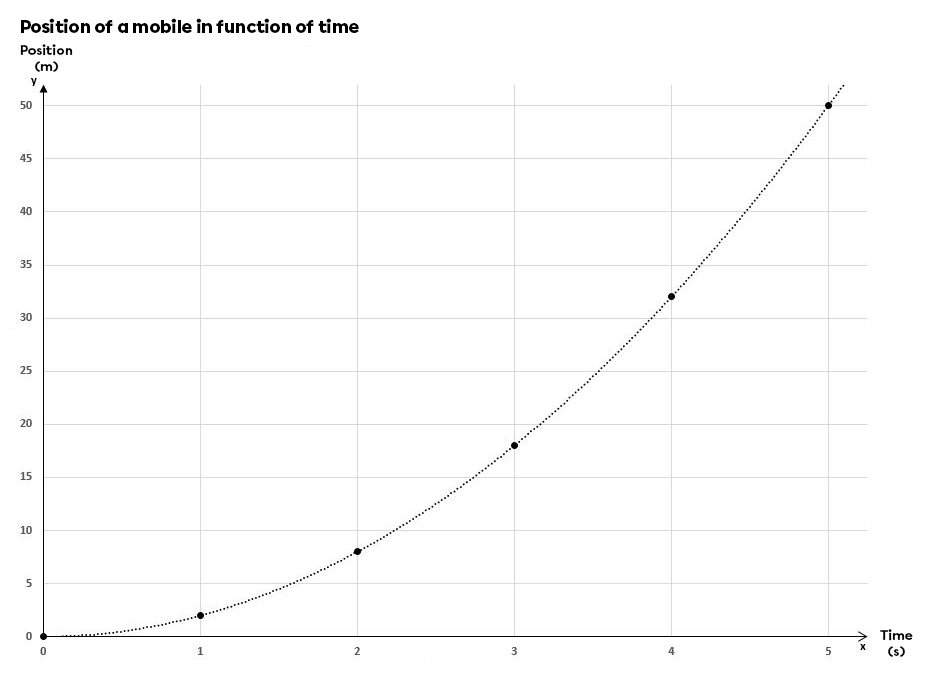
If the Position vs. Time Graph gives a quadratic function, the object moves with constant acceleration: its velocity is increasing steadily. This graph therefore represents a Uniformly Accelerated Rectilinear Motion (UARM).
|
 |
|
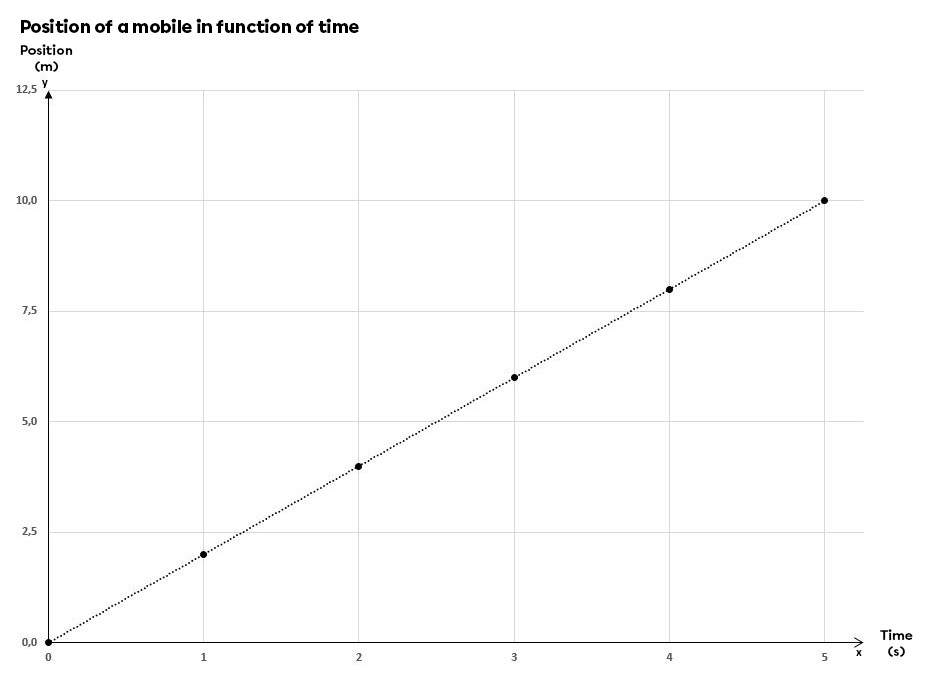
If the Position vs. Time Graph gives a linear function, the object moves with constant velocity, without accelerating. This graph represents a Uniform Rectilinear Motion (URM).
|
 |
|
The mobile is stationary if the Position vs. Time Graph gives a zero slope function.
|
 |
When studying the motion of an object, we use a Position vs. Time Graph to identify the type of motion performed and to locate the object's position at any given time.
The Position vs. Time Graph tells us where an object is located at any given time.

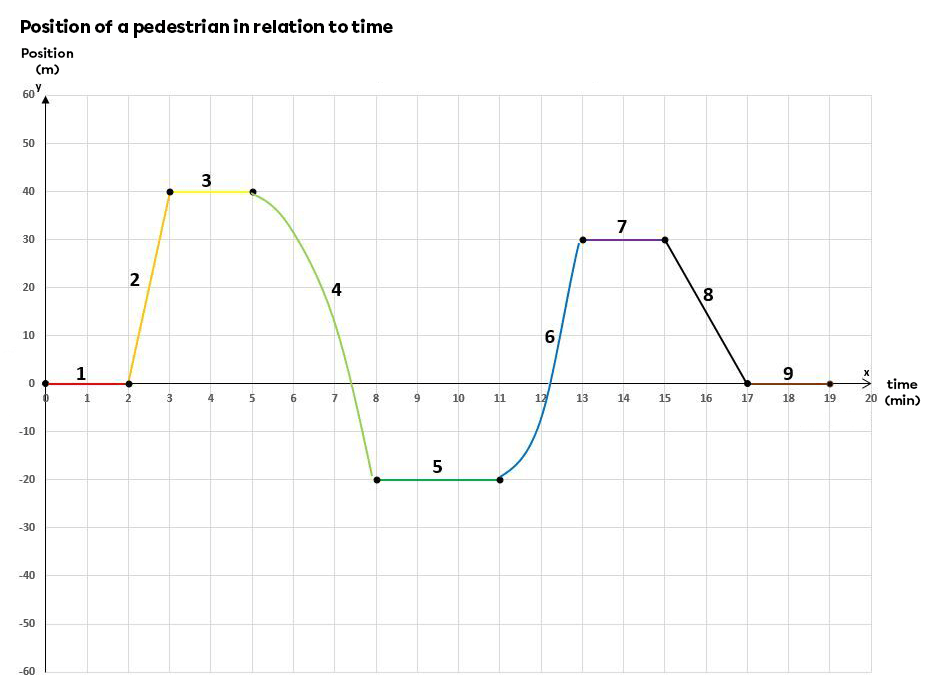
From the above example, the following pieces of information can be deducted.
- The segment is horizontal and superimposed on the x-axis for the first two minutes. This means the pedestrian is not moving. Her position has not changed and she is still at her starting point. In other words, she is at position zero.
- The straight line then shows that she moved at a constant velocity for one minute.
- She then took a two-minute break, 40 m from her starting point.
- She then accelerated between the fourth and eighth minutes. The direction of the curve indicates that she did turn back: in fact, she passed in front of her starting point between the seventh and eighth minutes. This type of curve is often seen in motions with negative acceleration, such as free fall or projectile motion.
- She took another break between the eighth and eleventh minutes, 20 m from her home, but on the opposite side of her starting point.
- She then accelerated for the next two minutes, covering 50 m in two minutes. She passed her starting point between the twelfth and thirteenth minutes.
- She took another two-minute break, 30 m from her starting point.
- She returned to her starting point, maintaining a constant velocity throughout. She covered 30 m in two minutes. Given this information, it would be possible to calculate the average velocity during her journey. When we compare this segment with segment 2, the slope is less steep: this means that her velocity was lower during this return to the starting point than it was in segment 2.
- Once arrived at her starting point, she remained motionless for the last two minutes.