Generally, the rate of a chemical reaction tends to change over the course of the reaction. The following graph represents what is usually observed for a first order or second order reaction.
-
At the beginning of a reaction, the concentration of reactants is high, which means that many reactant particles can undergo inelastic collisions, resulting in a high initial reaction rate.
-
However, as the reactants are gradually transformed into products and their concentration decreases, fewer reactant particles can undergo inelastic collisions, leading to a lower reaction rate.
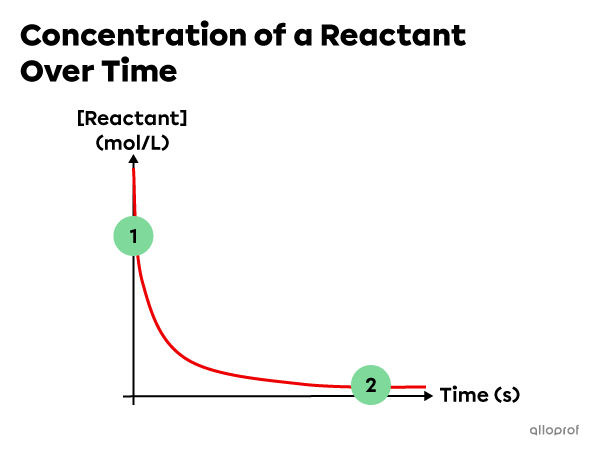
As a result of this progression, the reaction rate can be determined at a particular point in time or for the overall reaction.
Consider the following analogy: when a truck transports merchandise between two cities, its speed varies. The speed of the truck is high on the highway and decreases considerably in the city. It is possible to determine the speed of the truck at any given instant. It is also possible to determine the average speed of the truck for the whole trip or for a particular period of time. Similarly, it is possible to determine the average reaction rate and the instantaneous reaction rate of a chemical reaction.
-
The average reaction rate is the change in the amount of a given reactant or product over a specified period of time.
-
The instantaneous reaction rate is the rate at a specific instant during a chemical reaction.
The average reaction rate corresponds to the slope of the secant that intersects the curve of a concentration graph at any two points.
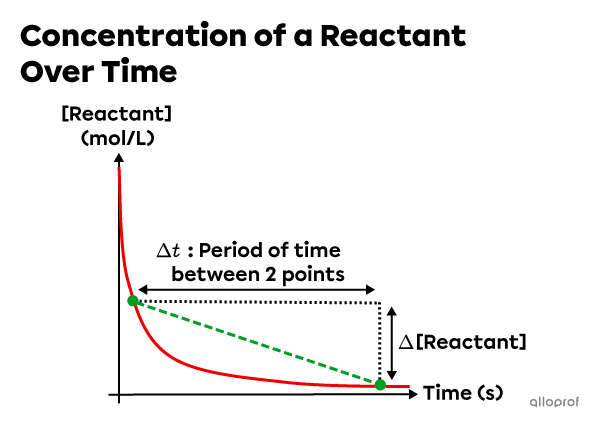
The average reaction rate can be calculated as follows: |r_{average}=\vert \text{slope}_{\text{secant}}\vert=\dfrac{\vert \Delta [\text{Reactant}]\vert}{\Delta t}|
The instantaneous reaction rate corresponds to the slope of the tangent that touches the curve of a concentration graph at the specific point in time.

The instantaneous reaction rate can be calculated as follows: |r_{instantaneous}=\vert \text{slope}_{\text{tangent}}\vert=\dfrac{\vert \Delta [\text{Reactant}]\vert}{\Delta t}|
Note that while the amount of a given product or a reactant is usually expressed in terms of its concentration, there are other methods of measuring the reaction rate. In fact, the method is sometimes chosen based on whether the average or the instantaneous reaction rate is to be determined.
When data is collected at regular time intervals during the reaction, it is usually summarized in a table and, often, in a graph. This information can be used to calculate the desired reaction rate.
The average reaction rate can be calculated between any two points on the curve representing the change in the amount of a product or a reactant over time. The average reaction rate corresponds to the absolute value of the slope of the secant that intersects the curve at any two points.
Magnesium |(\text{Mg})| and sulphuric acid |(\text{H}_2\text{SO}_4)| react to form magnesium sulphate |(\text{Mg}\text{SO}_4)| and hydrogen gas |(\text{H}_2)\!:|
|\text{Mg}_{\text{(s)}} + \text{H}_2\text{SO}_{4\text{(aq)}} \rightarrow \text{MgSO}_{4\text{(aq)}} + \text{H}_{2\text{(g)}}|
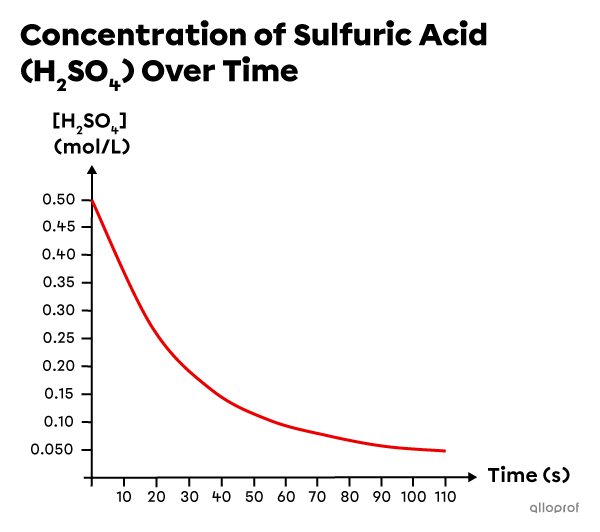
Based on experimental data, a graph is created to show the decreasing concentration of |\text{H}_2\text{SO}_4| over time.
Determine the average reaction rate between |20\ \text{s}| and |100\ \text{s}.|
-
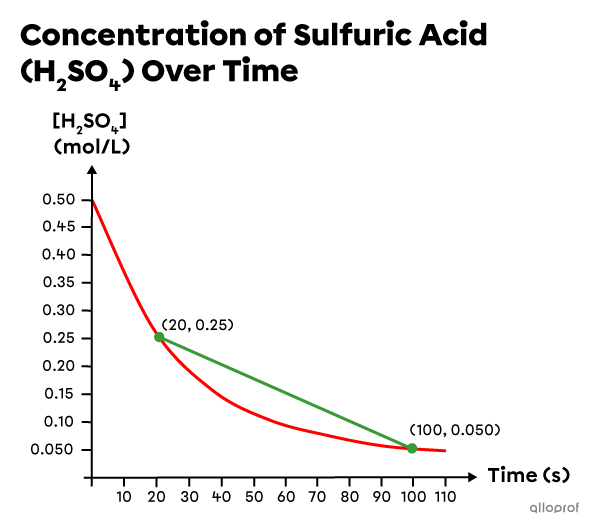
Draw a secant crossing the curve at the times of interest (|20\ \text{s}| and |100\ \text{s}|), and identify the concentration values that correspond to those times:
|\begin{align}
t_1&= 20\ \text{s}\\
[\text{H}_2\text{SO}_4]_1&= 0.25\ \text{mol/L}\\
t_2&= 100\ \text{s}\\
[\text{H}_2\text{SO}_4]_2&= 0.050\ \text{mol/L}
\end{align}| -
Use these values to determine the average reaction rate which corresponds to the slope of the secant:
|\begin{align}
r_{average}&=\vert \text{slope}_{\text{secant}}\vert=\dfrac{\vert \Delta [\text{H}_2\text{SO}_4]\vert}{\Delta t}\\\\
r_{average}&=\dfrac{\vert [\text{H}_2\text{SO}_4]_2 - [\text{H}_2\text{SO}_4]_1\vert}{t_2 - t_1}\\\\
r_{average}&= \dfrac{\vert 0.050\ \text{mol/L} - 0.25\ \text{mol/L}\vert}{100\ \text{s} - 20\ \text{s}}\\\\
r_{average}&= 2.5\times10^{-3}\ \text{mol/L}\cdot\text{s}
\end{align}|
Magnesium |(\text{Mg})| and hydrochloric acid |(\text{HCl})| react to form magnesium chloride |(\text{MgCl}_2)| and hydrogen gas |(\text{H}_2)\!:|
|\text{Mg}_{\text{(s)}} + 2\ \text{HCl}_\text{(aq)} \rightarrow \text{MgCl}_{2\text{(aq)}} + \text{H}_{2\text{(g)}}|
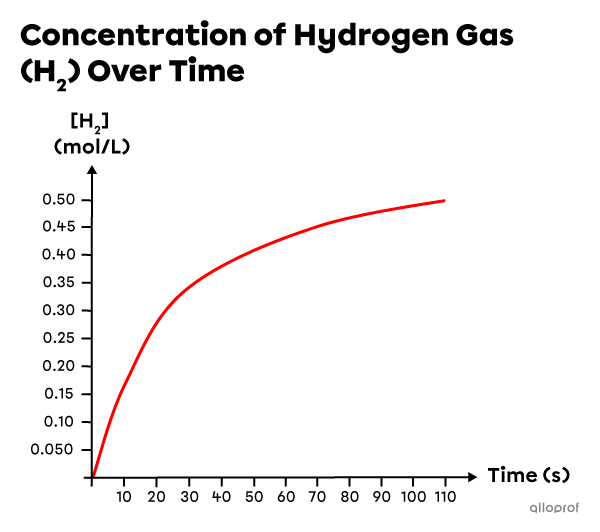
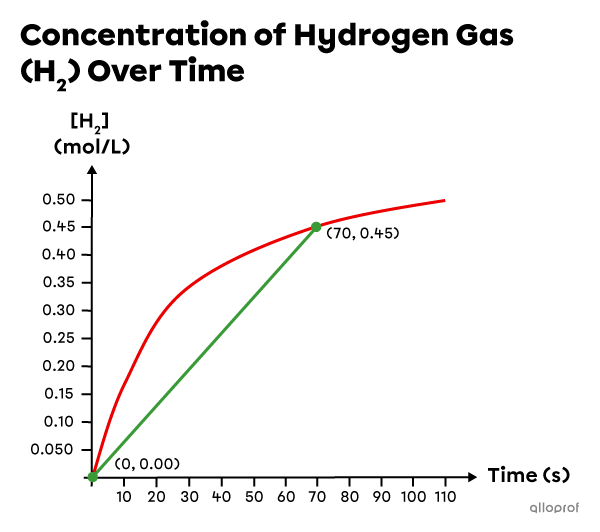
Based on experimental data, a graph is created to show the increasing concentration of |\text{H}_2| over time.
Determine the average reaction rate between the beginning of the reaction and |70\ \text{s}.|
-
Draw a secant crossing the curve at the times of interest (|0\ \text{s}| and |70\ \text{s}|), and identify the concentration values that correspond to those times:
|\begin{align}
t_1&= 0\ \text{s}\\
[\text{H}_2]_1&= 0.00\ \text{mol/L}\\
t_2&= 70\ \text{s}\\
[\text{H}_2]_2&= 0.45\ \text{mol/L}
\end{align}| -
Use these values to determine the average reaction rate which corresponds to the slope of the secant:
|\begin{align}
r_{average}&=\vert \text{slope}_{\text{secant}}\vert=\dfrac{\vert \Delta [\text{H}_2]\vert}{\Delta t}\\\\
r_{average}&=\dfrac{\vert [\text{H}_2]_2 - [\text{H}_2]_1\vert}{t_2 - t_1}\\\\
r_{average}&= \dfrac{\vert 0.45\ \text{mol/L} - 0.00\ \text{mol/L}\vert}{70\ \text{s} - 0\ \text{s}}\\\\
r_{average}&\approx 6.4\times10^{-3}\ \text{mol/L}\cdot\text{s}
\end{align}|
The instantaneous reaction rate can be calculated from a graph representing the change in the amount of a reactant or product as a function of time. The rate of a reaction at a specific instant corresponds to the absolute value of the slope of the tangent touching the curve at the specified time.
Hydrogen gas |(\text{H}_2)| and iodine gas |(\text{I}_2)| react to form hydrogen iodide |(\text{HI})\!:|
|{\text{H}_{2{\text{(g)}}} + \text{I}_{2{\text{(g)}}} \rightarrow 2\ \text{HI}_{\text{(g)}}}.|
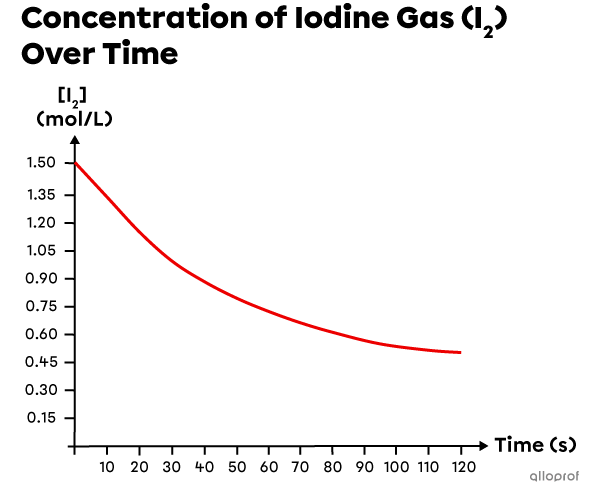
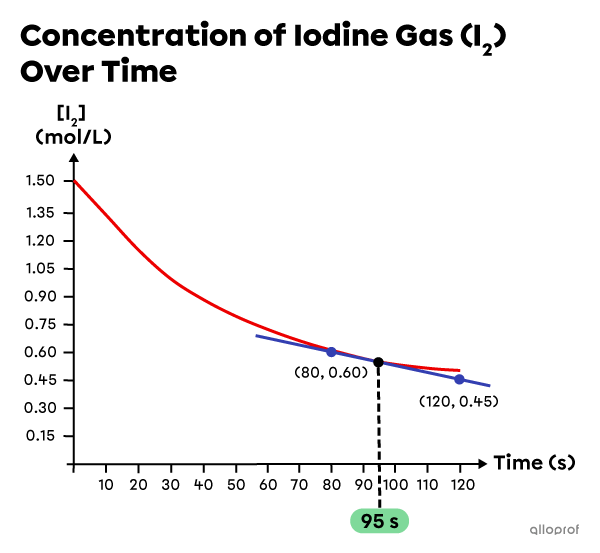
Based on experimental data, a graph is created to show the decreasing concentration of |\text{I}_2| over time.
Determine the instantaneous reaction rate at |95\ \text{s}.|
-
Draw a tangent touching the curve at the time of interest |(95\ \text{s}).| Chose two points on the tangent and identify their coordinates:
|\begin{align}
t_1&= 80\ \text{s}\\
[\text{I}_2]_1&= 0.60\ \text{mol/L}\\
t_2&= 120\ \text{s}\\
[\text{I}_2]_2&= 0.45\ \text{mol/L}
\end{align}| -
Use these values to determine the instantaneous reaction rate which corresponds to the slope of the tangent:
|\begin{align}
r_{instantaneous}&=\vert \text{slope}_{\text{tangent}}\vert=\dfrac{\vert \Delta [\text{I}_2]\vert}{\Delta t}\\\\
r_{instantaneous}&=\dfrac{\vert [\text{I}_2]_2 - [\text{I}_2]_1\vert}{t_2 - t_1}\\\\
r_{instantaneous}&= \dfrac{\vert 0.45\ \text{mol/L} - 0.60\ \text{mol/L}\vert}{120\ \text{s} - 80\ \text{s}}\\\\
r_{instantaneous}&\approx 3.8\times10^{-3}\ \text{mol/L}\cdot\text{s}
\end{align}|
Nitrogen dioxide |(\text{NO}_2)| reacts with carbon monoxide |(\text{CO})| to form nitrogen monoxide |(\text{NO})| and carbon dioxide |(\text{CO}_2)\!:|
|\text{NO}_{2\text{(g)}} + \text{CO}_{\text{(g)}} \rightarrow \text{NO}_{\text{(g)}} + \text{CO}_{2\text{(g)}}.|
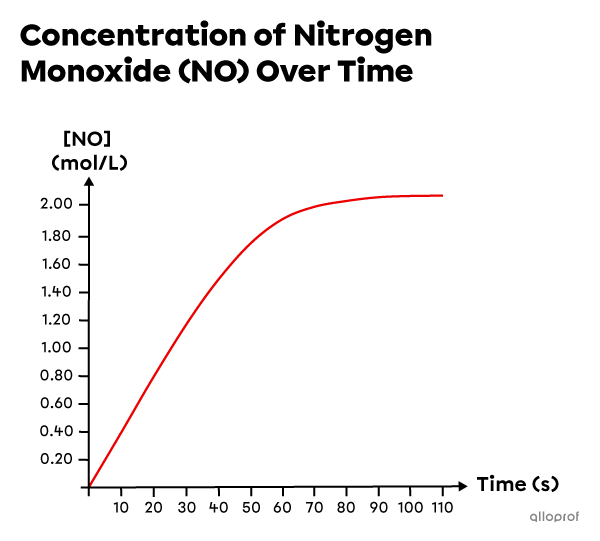
Based on experimental data, a graph is created to show the increasing concentration of |\text{NO}| over time.
Determine the instantaneous reaction rate at |60\ \text{s}.|
-
Draw a tangent crossing the curve at the times of interest |(60\ \text{s}).| Chose two points on the tangent and identify their coordinates:
|\begin{align}
t_1&= 20\ \text{s}\\
[\text{NO}]_1&= 1.40\ \text{mol/L}\\
t_2&= 50\ \text{s}\\
[\text{NO}]_2&= 1.80\ \text{mol/L}
\end{align}| -
Use these values to determine the instantaneous reaction rate which corresponds to the slope of the tangent:
|\begin{align}
r_{instantaneous}&=\vert \text{slope}_{\text{tangent}}\vert=\dfrac{\vert \Delta[\text{NO}]\vert}{\Delta t}\\\\
r_{instantaneous}&=\dfrac{\vert [\text{NO}]_2 - [\text{NO}]_1\vert}{t_2 - t_1}\\\\
r_{instantaneous}&= \dfrac{\vert 1.80\ \text{mol/L} - 1.40\ \text{mol/L}\vert}{50\ \text{s} - 20\ \text{s}}\\\\
r_{instantaneous}&\approx 1.3\times10^{-2}\ \text{mol/L}\cdot\text{s}
\end{align}|

To determine the average reaction rate or the instantaneous reaction rate, it is usually necessary to construct a graph using the experimental data.
Calcium |(\text{Ca})| and hydrochloric acid |(\text{HCl})| react to form calcium chloride |(\text{CaCl}_2)| and hydrogen gas |(\text{H}_2)\!:|
|\text{Ca}_{\text{(s)}} + 2\ \text{HCl}_{\text{(aq)}}\rightarrow \text{CaCl}_{2\text{(aq)}} + \text{H}_{2\text{(g)}}|
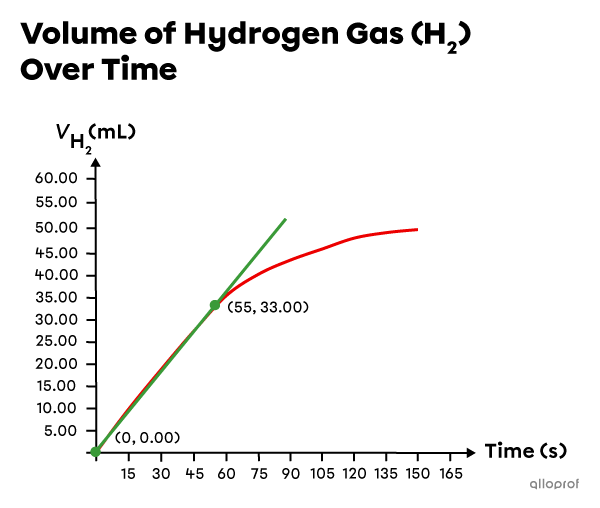
The following table presents data collected during the experiment: the volume of |(\text{H}_2)| collected over the course of the experiment.
|
Time |\text{(s)}| |
|0| |
|15| |
|30| |
|45| |
|60| |
|75| |
|90| |
|105| |
|120| |
|135| |
|150| |
|---|---|---|---|---|---|---|---|---|---|---|---|
|
|V_{\text{H}_2}\ \text{(mL)}| |
|0.00| |
|10.00| |
|19.00| |
|28.00| |
|36.00| |
|41.00| |
|44.00| |
|46.50| |
|48.00| |
|49.50| |
|50.00| |
a) Determine the average reaction rate during the first |55\ \text{s}.|
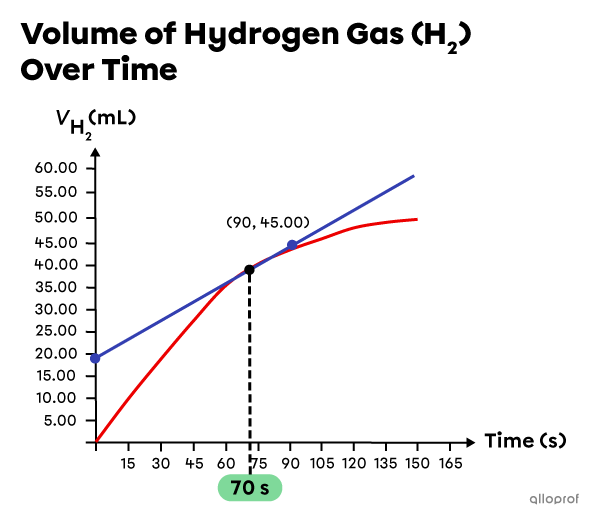
b) Estimate the instantaneous reaction rate at |70\ \text{s}.
Before performing any calculations, construct a graph representing the change in volume of |(\text{H}_2)| over time.
a) Determine the average reaction rate during the first |55\ \text{s}.|
-
Draw a secant crossing the volume graph at the desired times (|0\ \text{s}| and |55\ \text{s}|), and identify the corresponding volume values:
|\begin{align}
t_1&= 0\ \text{s}\\
V_{{\text{H}_{2_1}}}&= 0.00\ \text{mL}\\
t_2&= 55\ \text{s}\\
V_{{\text{H}_{2_2}}}&= 33.00\ \text{mL}
\end{align}| -
Use these values to determine the average reaction rate:
|\begin{align}
r_{average}&=\vert \text{slope}_{\text{secant}}\vert=\dfrac{\vert \Delta V_{\text{H}_2}\vert}{\Delta t}\\\\
r_{average}&=\dfrac{\vert V_{{\text{H}_{2_2}}} - V_{{\text{H}_{2_1}}}\vert}{t_2 - t_1}\\\\
r_{average}&= \dfrac{\vert 33.00\ \text{mL} - 0.00\ \text{mL}\vert}{55\ \text{s} - 0\ \text{s}}\\\\
r_{average}&= 0.60\ \text{mL/s}
\end{align}|
b) Estimate the instantaneous reaction rate at |70\ \text{s}.|
-
Draw a tangent crossing the curve at |70\ \text{s}| and identify the coordinates of two points on this tangent:
|\begin{align}
t_1&= 0\ \text{s}\\
V_{{\text{H}_{2_1}}}&= 20.00\ \text{mL}\\
t_2&= 90\ \text{s}\\
V_{{\text{H}_{2_2}}}&= 45.00\ \text{mL}
\end{align}| -
Use these values to determine the instantaneous reaction rate which corresponds to the slope of the tangent:
|\begin{align}
r_{instantaneous}&=\vert \text{slope}_{\text{tangent}}\vert=\dfrac{\vert \Delta V_{\text{H}_2}\vert}{\Delta t}\\\\
r_{instantaneous}&=\dfrac{\vert V_{{\text{H}_{2_2}}} - V_{{\text{H}_{2_1}}}\vert}{t_2 - t_1}\\\\
r_{instantaneous}&= \dfrac{\vert 45.00\ \text{mL} - 20.00\ \text{mL}\vert}{90\ \text{s} - 0\ \text{s}}\\\\
r_{instantaneous}&\approx 0.28\ \text{mL/s}
\end{align}|
Sometimes, the reaction rate has to be determined in |\text{mol/s}| or |\text{mol/L}\cdot\text{s},| but the data provides other measurements, such as mass |(m)| or volume |(V).| They can be converted to the desired units using the molar mass formula, Avogadro’s law and molar volume or the ideal gas law.