Two parameters are present in the linear function: the parameter |a,| called the rate of change or slope, and the parameter |b,| called the |y|-intercept or the initial value.
The equation of a linear function is ||f(x) = \color{red}{a}x + \color{blue}{b}|| where |\color{red}{a}| and |\color{blue}{b}| are real numbers.
In the following interactive animation, experiment with the values of the parameters |a| and |b| of the function by using the cursors. It is also possible to move the two points of the line directly on the graph. Afterwards, continue reading the concept sheet for all of the details about these two parameters.
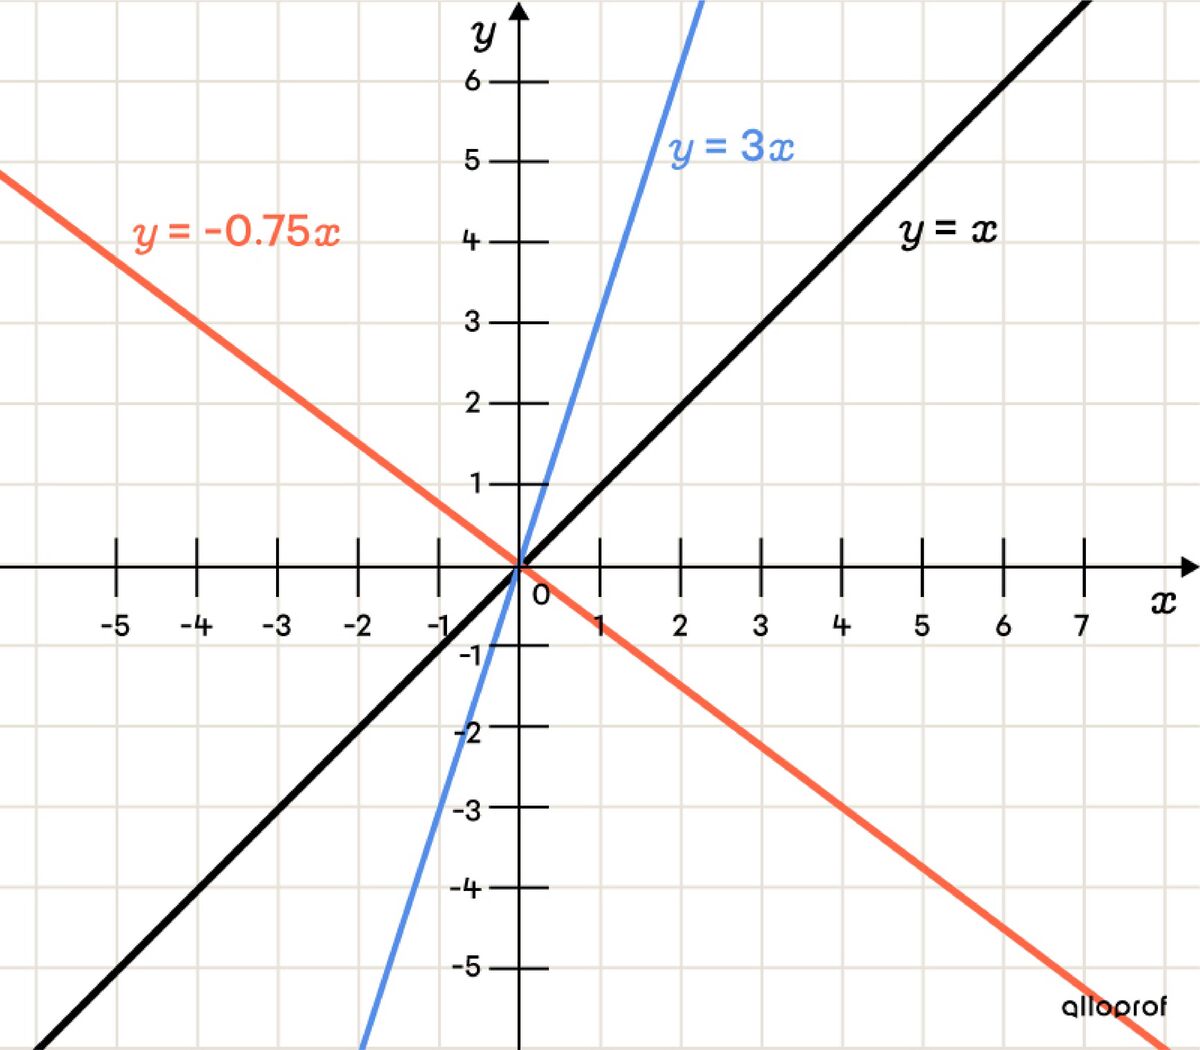
The parameter |a| is responsible for the incline of the line. Therefore, the value and the sign of the parameter |a| has a direct influence on the variation of the line or whether the line increases or decreases.
When |a| is positive |(a>0)|:
-
the line is increasing;
-
the line’s rate of change is more steep as the value of parameter |a| increases. Visually, it approaches the |y|-axis;
-
the line becomes less steep as the value of parameter |a| decreases. Visually, it approaches the |x|-axis.
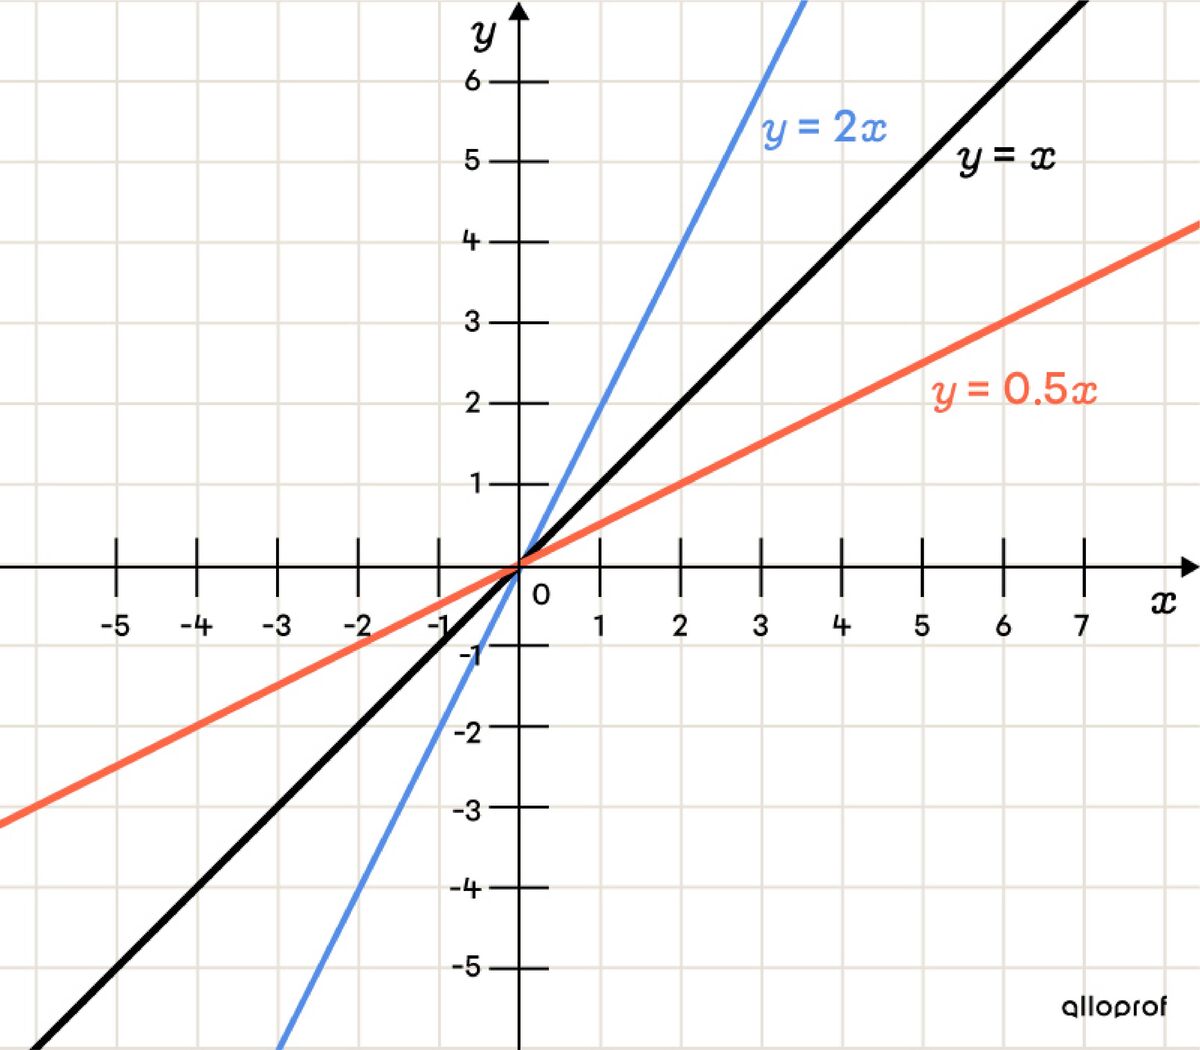
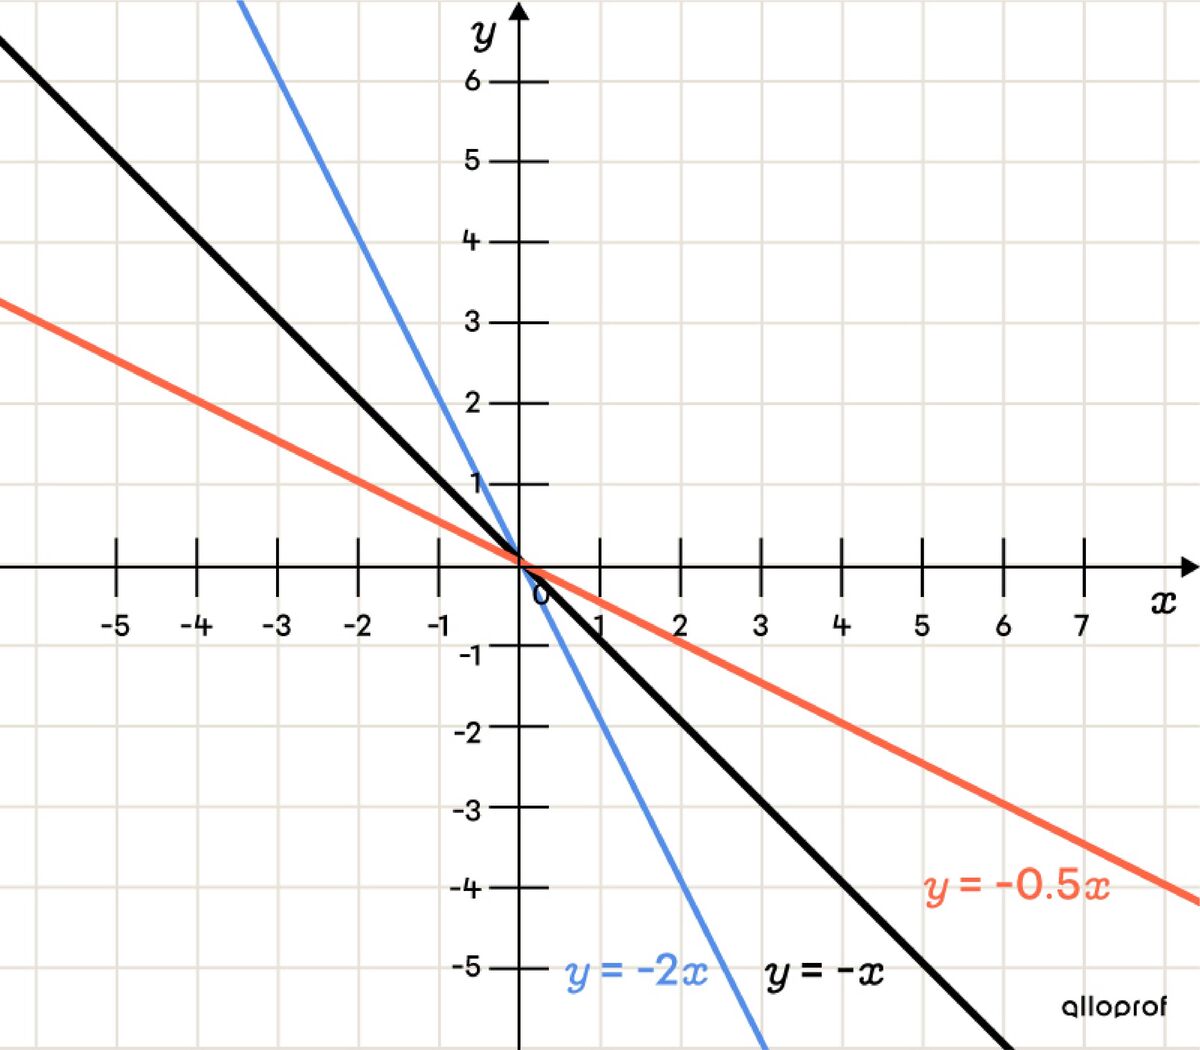
When |a| is negative |(a<0):|
-
the line is decreasing;
-
the line slopes downwards more steeply as the value of parameter |a| decreases. Visually, it approaches the |y|-axis;
-
the line slopes downwards less steeply as the value of parameter |a| increases. Visually, it approaches the |x|-axis.
When the value of |a| is zero |(a=0):|
-
the line is constant (horizontal). In this case, it is a constant function (also called a 0-degree polynomial) and is written as follows: |f(x)=b.|
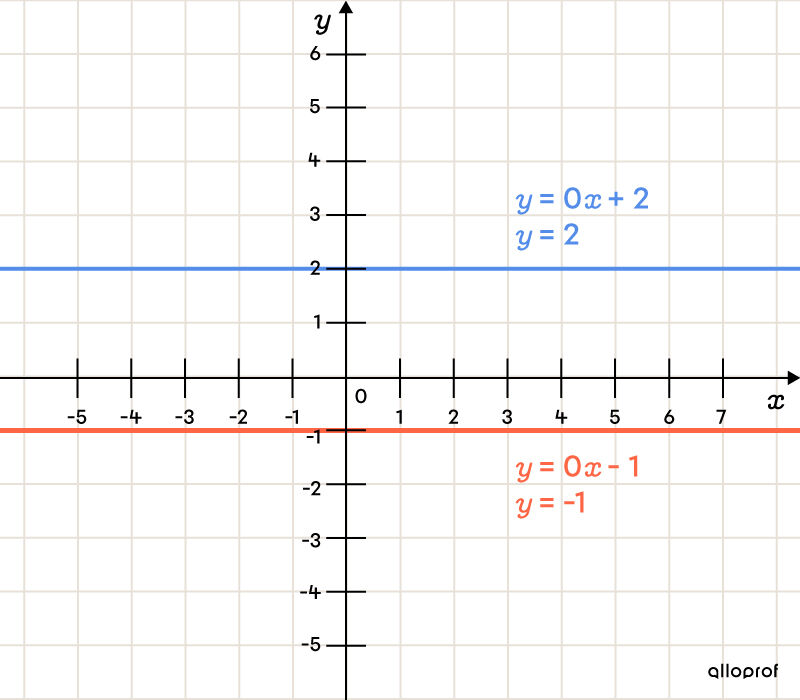
Unlike the parameter |a,| the parameter |b| does not change the line’s incline, but rather its position on the Cartesian plane. The parameter |b| indicates the value of the |y|-intercept.
When |b| is positive |(b>0):|
-
the whole line moves upwards.
When |b| is negative |(b<0):|
-
the whole line moves downwards.
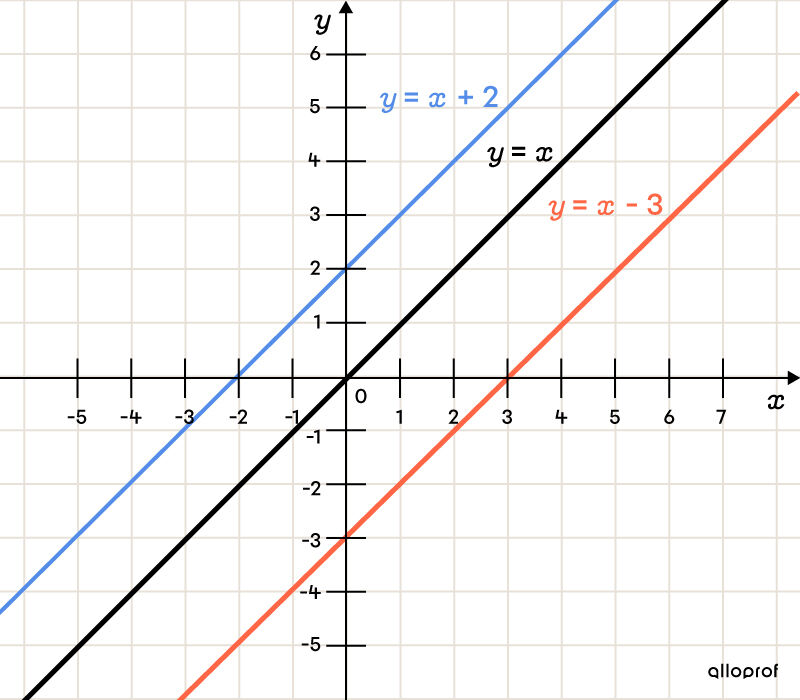
When the value of |b| is zero |(b=0):|
-
the line passes through the origin of the Cartesian plane. For this reason, it is called a line passing through the origin and is written as follows: |f(x)=ax.|
