Two parameters are present in the linear function: the parameter |a,| called the rate of change or slope, and the parameter |b,| called the |y|-intercept or the initial value.
The equation of a linear function is represented by:
||f(x) = \color{red}{a}x + \color{blue}{b}||
where |\color{red}{a}| and |\color{blue}{b}| are real numbers.
In a relationship between two variables, the rate of change (usually represented by the letter |a|) is the relationship between two corresponding changes of the variables.
When two values are related, a change in the values of the independent variable leads to a change in the corresponding values of the dependent variable. It is then possible to define the rate of change as follows.
||\text{Rate of change} = \dfrac{\text{Change in the dependent variable}}{\text{Change in the independent variable}}||
It can be simplified by the following expression.
||a=\dfrac{\Delta y}{\Delta x} = \dfrac{y_2 - y_1}{x_2 - x_1}||
Where |(x_1,y_1)| and |(x_2,y_2)| are two distinct points on the line and |\Delta| is the Greek letter delta representing a change.
In analytical geometry, the rate of change is called the slope of a line.
The |y|-intercept, also called the initial value and denoted |b,| corresponds to the value of the dependent variable |(y)| when the value of the independent variable |(x)| is |0.| Plotted on a graph, the |y|-intercept is the point of intersection between the line and the |y|-axis.
In the following interactive animation, you can modify the value of the parameters |a| and |b| of the linear function using the sliders. It’s also possible to move the two points of the line directly on the graph. Then, you can continue reading the concept sheet to learn how to determine the rate of change |(a)| and the initial value |(b)| from the equation of the line, a table of values, a graph, or a word problem.
The rate of change is denoted by the coefficient of the independent variable |(x).|
The |y|-intercept is the constant term.
In the equation below, the letter |\color{red}{a}| represents the rate of change and the letter |\color{blue}{b}| represents the |y|-intercept. ||y=\color{red}{a}x+\color{blue}{b}||
Examples of equations and their corresponding rate of change.
|
Equation |
Rate of change |
|y|-intercept |
|---|---|---|
|
|y=3x-9| |
|+3| |
|-9| |
|
|y=-8x+2| |
|-8| |
|+2| |
|
|y=4+9x| |
|+9| |
|+4| |
|
|y=\frac{1}{2} - \frac{3}{4}x| |
|- \frac{3}{4}| |
|+\frac{1}{2}| |
|
|y=x+7| |
|+1| |
|+7| |
|
|y=-x+8| |
|-1| |
|+8| |
|
|y=78| |
|0| |
|+78| |
To determine the rate of change and the |y|-intercept, |y| must be isolated on one side of the equation. In other words, the equation must be in the form |y=ax+b|. If it is not the case, we need to isolate the variable |y.|
Here are three examples where we are looking for the rate of change and the |y|-intercept.
Example 1: ||\begin{align} 2y &= 4x+8 \\ \frac{2y}{\color{green}{2}} &= \frac{4x}{\color{green}{2}} + \frac{8}{\color{green}{2}} \\ y &= \color{red}{2}x+\color{blue}{4} \end{align}||
The rate of change of the equation is |\color{red}{2}| and the |y|-intercept is |\color{blue}{4}.|
Example 2: ||\begin{align} y+6x &= 7 \\ y+6x \color{green}{-6x} &= 7 \color{green}{-6x} \\ y &= 7-6x \\ y &= \color{red}{-6}x+\color{blue}{7} \end{align}||
The rate of change of the equation is |\color{red}{-6}| and the |y|-intercept is |\color{blue}{7}.|
Example 3: ||\begin{align} \frac{y}{2}-\frac{6x}{5} &= -3 \\ \frac{y}{2}-\frac{6x}{5} \color{green}{+\frac{6x}{5}} &= -3 \color{green}{+\frac{6x}{5}}\\ \frac{y}{2} &= -3 + \frac{6x}{5} \\ \frac{y}{2} \color{green}{\times 2} &= \left(-3 + \frac{6x}{5}\right) \color{green}{\times 2} \\ y &= -6+\frac{12x}{5} \\y &= \color{red}{\frac{12}{5}}x \color{blue}{-6} \end{align}||
The rate of change of the equation is |\color{red}{\dfrac{12}{5}}| and the |y|-intercept is |\color{blue}{-6}.|
To calculate the rate of change and the initial value, we need to follow these 4 steps.
-
Identify the dependent and independent variables.
-
Choose 2 points on the line or 2 ordered pairs from the table of values.
-
Apply the formula for the rate of change. ||a=\dfrac{\Delta y}{\Delta x}=\dfrac{y_2 - y_1}{x_2 - x_1}||
-
Replace |a| with the value calculated in the previous step and |x| and |y| with the coordinates of a point, and then isolate |b.|
Note: sometimes, step 4 is not necessary to get the |y|-intercept, since it can be found directly in the graph or the table of values.
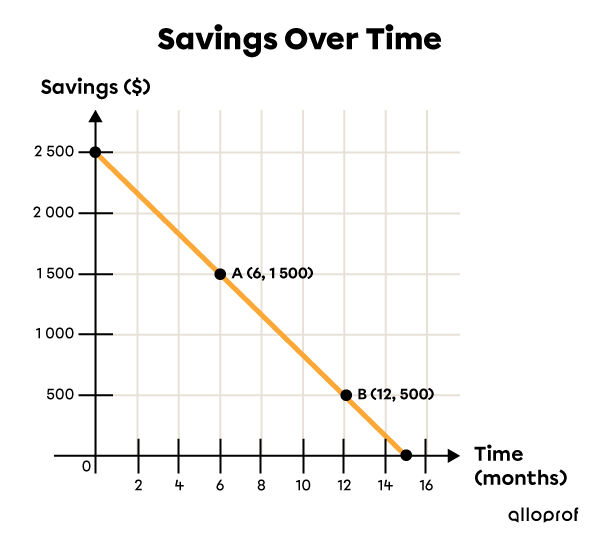
In the following example, we consider that the individual’s consumption habits are constant.
-
How much money does the individual save per month? (rate of change)
-
How much did they have saved at the start of the study? (|y|-intercept)
-
Identify the dependent and independent variables
|x=| Elapsed time (months)
|y=| Savings |($)| -
Choose 2 points on the line
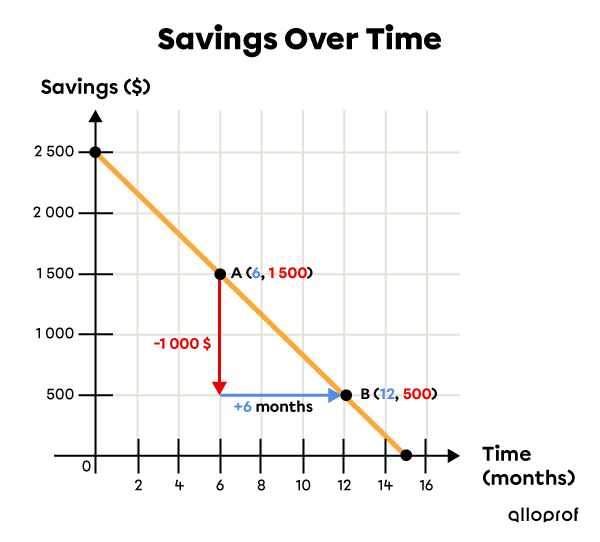
Determine directly on the graph the vertical displacement |(\color{red}{\Delta y})| and the horizontal displacement |(\color{#558dec}{\Delta x})| between 2 chosen points.
-
Apply the rate of change formula
The vertical displacement |(\color{red}{\Delta y})| divided by the horizontal displacement |(\color{#558dec}{\Delta x})| gives the rate of change : ||\begin{align} \color{green}{a} &=\ \dfrac{\color{red}{\Delta y}}{\color{#558dec}{\Delta x}} \\ &=\dfrac{\color{red}{-1000}}{\color{#558dec}{+6}} \\ &= \color{green}{-\dfrac{500}{3}} \\&\approx \color{green}{- $166.67} / \text{month} \end{align}||Since the rate of change is negative, it means the individual's savings decrease by approximately |$166.67| per month. In other words, he withdraws |$166.67| every month from his savings.
-
Replace |\color{green}{a}| by |\color{green}{-166.67}| and |\color{#558dec}{x}| and |\color{red}{y}| with the coordinates of a point, then isolate |\color{blue}{b}|
The initial value is already clearly indicated on the graph: |\$ \color{blue}{2\ 500}.|
Thus, it is not necessary to calculate |\color{blue}{b}.|
The equation for this situation is: |y= \color{green}{-\dfrac{500}{3}}x + \color{blue}{2\ 500}| or |y \approx \color{green}{-166.67}x + \color{blue}{2\ 500}.|
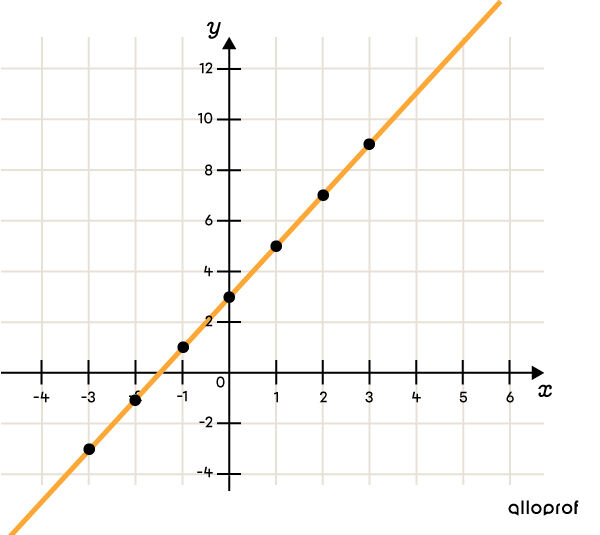
What is the rate of change |(a),| the initial value |(b),| and the equation of the straight line illustrated in the following Cartesian plane?
-
Identify the dependent and independent variables
|x=| the independent variable.
|y=| the dependent variable.Note: here, defining the variables in a more precise way is not possible since the question has no particular context.
-
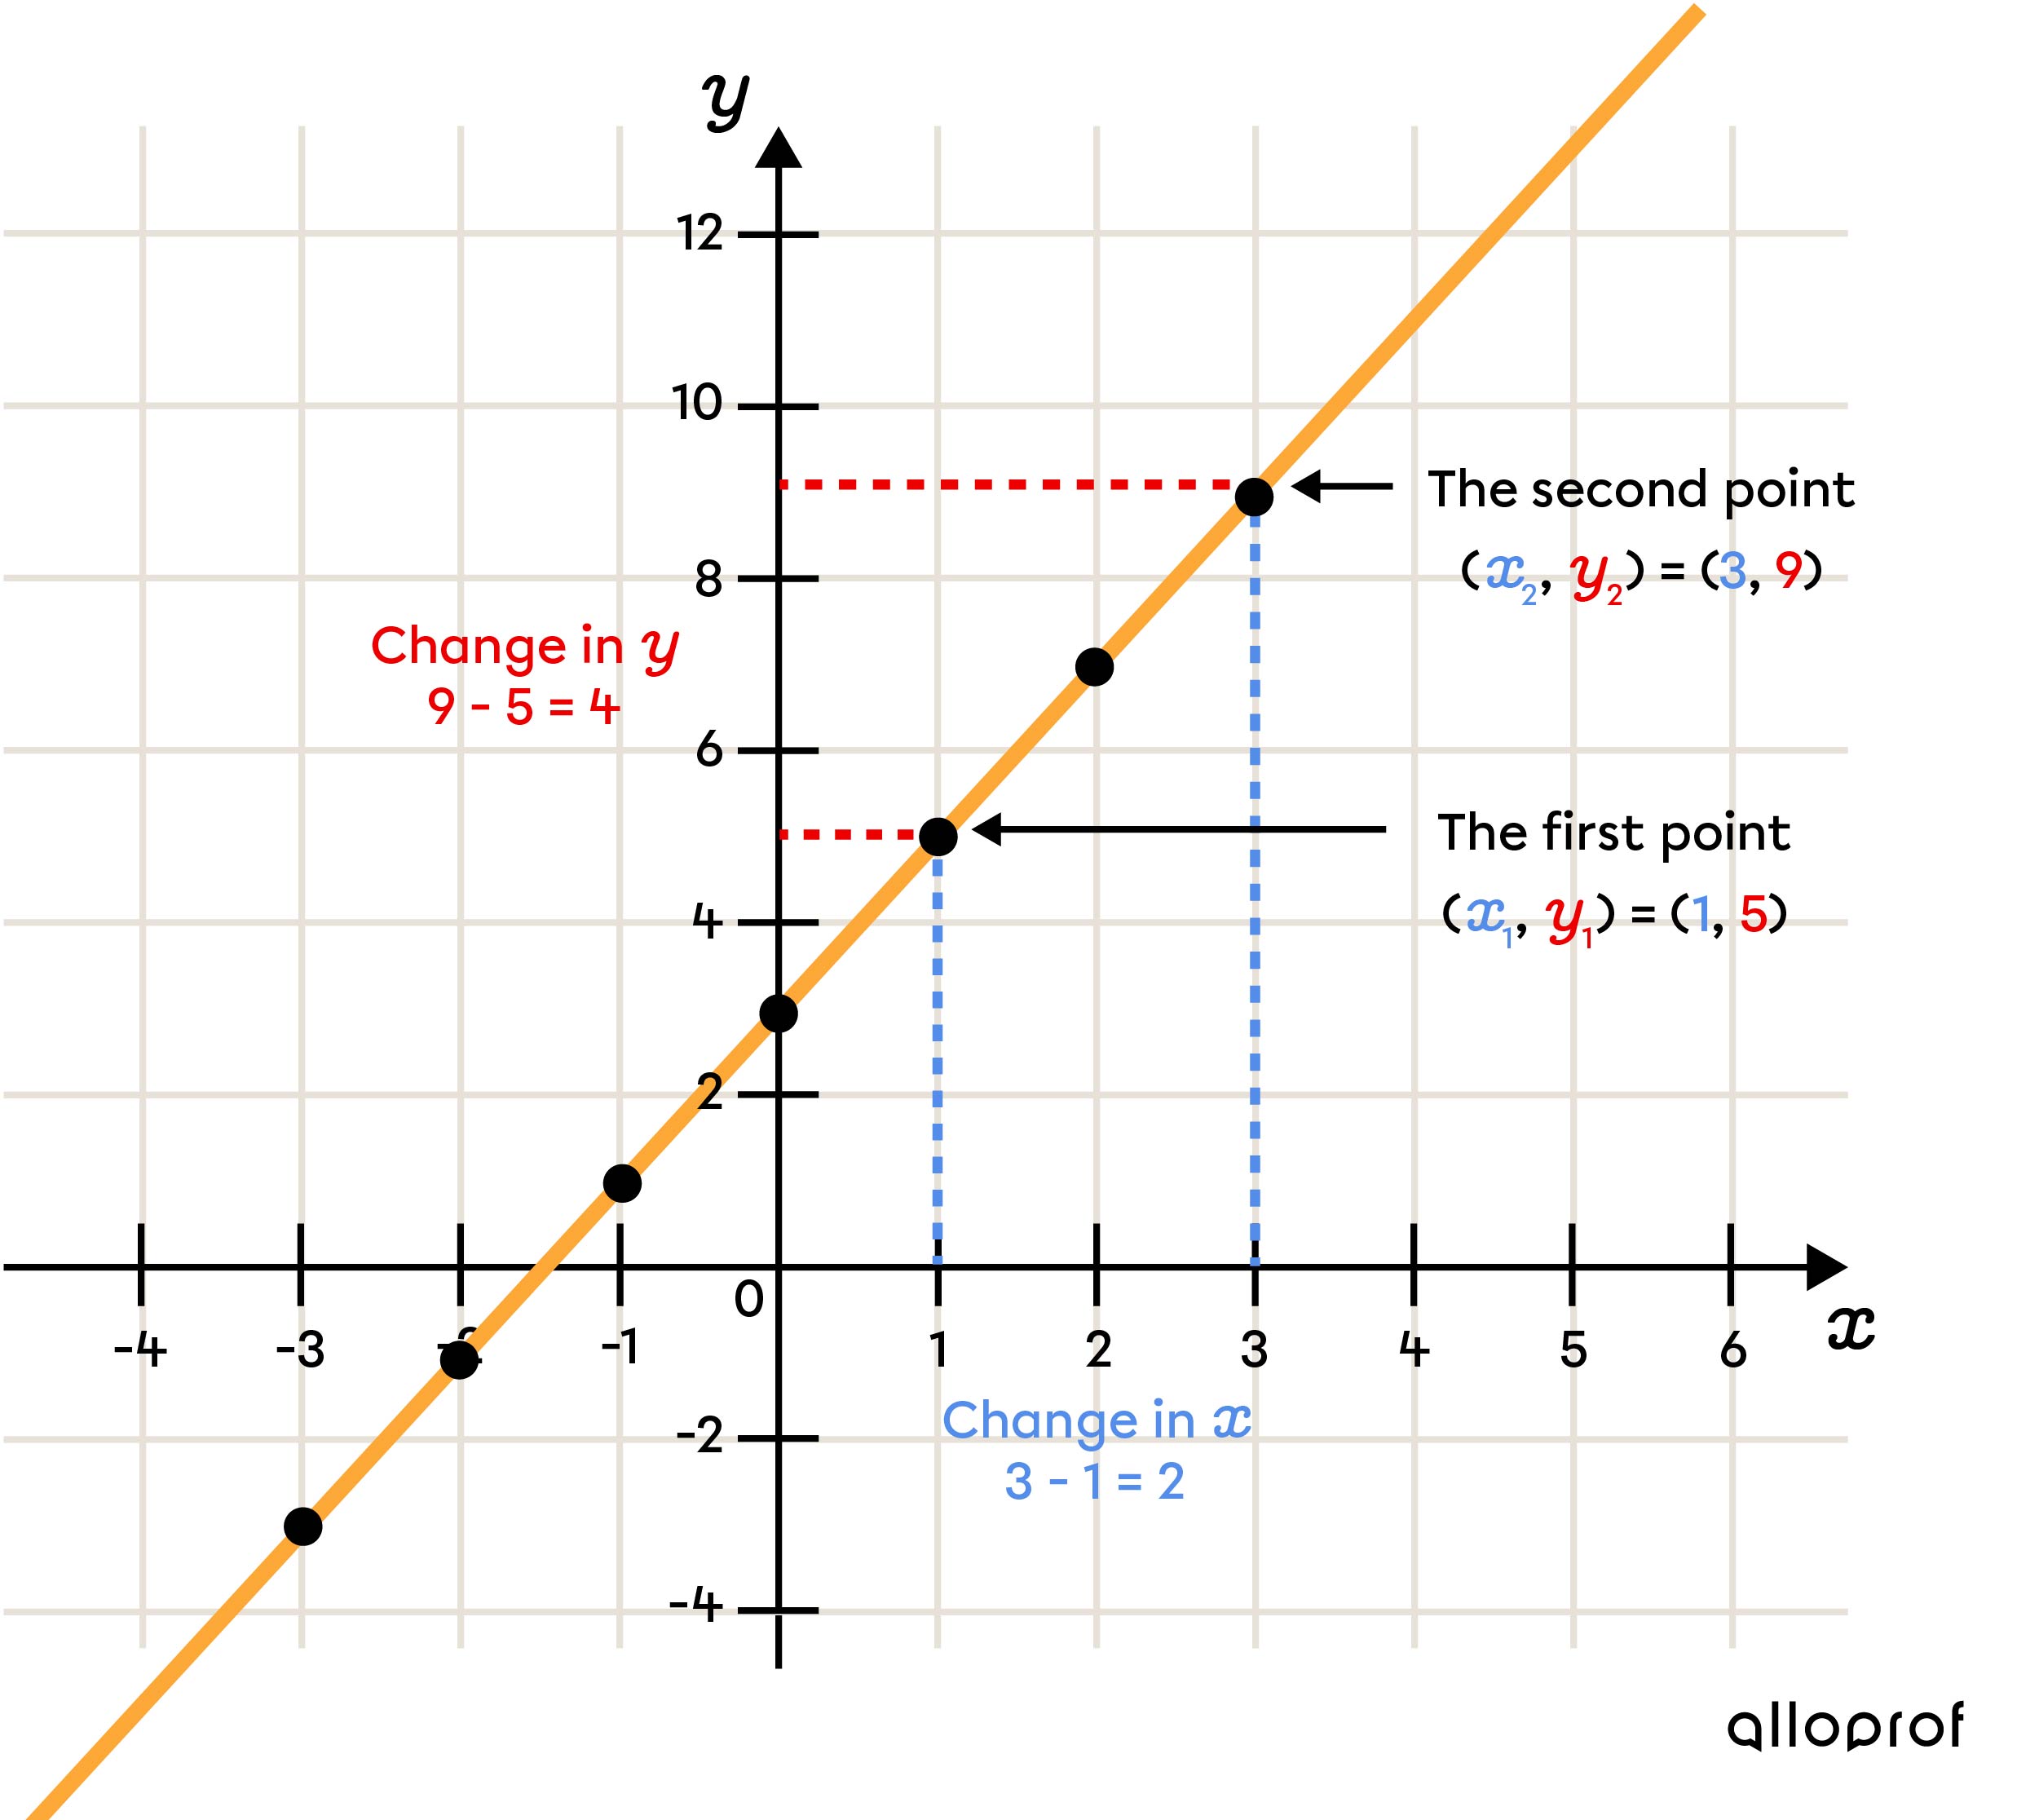
Select two points on the line
-
Apply the rate of change formula
||\begin{align} \color{green}{a}=\dfrac{\Delta y}{\Delta x}&= \dfrac{\color{red}{y_2}-\color{red}{y_1}}{\color{#548de9}{x_2}-\color{#548de9}{x_1}}\\&=\dfrac{\color{red}{9}-\color{red}{5}}{\color{#548de9}{3}-\color{#548de9}{1}} \\ &= \dfrac{4}{2} \\ &= \color{green}{2} \end{align}||The rate of change in the graph is |\color{green}{2}.|
The |y|-intercept appears to be between |2| and |4| on the graph. Assuming the value is |3| would be okay, but it is better to do the math to make sure.
-
Replace |\color{green}{a}| by |\color{green}{2}| as well as |\color{#548de9}{x}| and |\color{red}{y}| by the coordinates of a point, then isolate |\color{blue}{b}|||\begin{align} y &= \color{green}{a}x + \color{blue}{b} \\ \color{red}{y} &= \color{green}{2}\color{#548de9}{x}+\color{blue}{b} \\ \color{red}{9} &= 2(\color{#548de9}{3}) +\color{blue}{b} \\ 9 &= 6 + \color{blue}{b} \\ 9\color{magenta}{-6} &= 6 \color{magenta}{-6} + \color{blue}{b} \\ \color{blue}{3} &= \color{blue}{b} \end{align}||Thus, the |y|-intercept is indeed |\color{blue}{3}.|
The equation is |y = \color{green}{2}x + \color{blue}{3}.|
To calculate the rate of change and the |y|-intercept from a table of values, we follow the same procedure as with the graph. To make it easier, you can draw a graph.
Marc has just opened a print shop. He bought a high-performance photocopier. He decided on the costs below for using the photocopier.
|
Number of photocopies |
|5| |
|10| |
|15| |
|20| |
|40| |
|75| |
|---|---|---|---|---|---|---|
|
Cost |($)| |
|\$ 0.65| |
|\$ 1.30| |
|\$ 1.95| |
|\$ 2.60| |
|\$ 5.20| |
|\$ 9.75| |
-
What is the price per photocopy?
-
What is the initial price?
-
Identify the dependent and independent variables
|x=| Number of photocopies
|y=| Cost -
Choose two points from the table of values
1st point: |10| photocopies for |\$ 1.30= \underset{\color{navy}{\Large{(x_1\ , \ \ y_1)\ \ }}}{\color{navy}{(10\ , 1.30)}}|
2nd point: |40| photocopies for |\$ 5.20= \underset{\color{green}{\Large{(x_2\ , \ \ y_2)\ \ }}}{\color{green}{(40\ , 5.20)}}|
-
Apply the rate of change formula
||\begin{align}\color{red}{a}=\frac{\Delta y}{\Delta x}&= \dfrac{\color{green}{y_2}-\color{navy}{y_1}}{\color{green}{x_2}-\color{navy}{x_1}}\\&=\dfrac{\color{green}{5.20}-\color{navy}{1.30}}{\color{green}{40}-\color{navy}{10}} \\ &= \dfrac{3.90}{30} \\ &= \color{red}{0.13} \end{align}||
In this example, the rate of change is the cost per photocopy. So, it costs |\$ \color{red}{0.13}| per photocopy.
-
Replace |\color{red}{a}| with |\color{red}{0.13}| and |\color{navy}{x}| and |\color{navy}{y}| with the coordinates of a point, and then isolate |\color{blue}{b}|
Here, the point used is |\color{navy}{(x,y)} = \color{navy}{(10\ , 1.30)},| but any other ordered pair from the table of values is possible. ||\begin{align} y &= \color{red}{a}x+\color{blue}{b} \\ \color{navy}{y} &= \color{red}{0.13}\color{navy}{x}+\color{blue}{b} \\ \color{navy}{1.30} &= 0.13(\color{navy}{10}) +\color{blue}{b} \\ 1.30 &= 1.30 + \color{blue}{b} \\ \color{blue}{0} &= \color{blue}{b} \end{align}||
The |y|-intercept (initial value), that is the initial price, is |\color{blue}{0}\ $.| Thus, it is a direct variation function, also called a linear function passing through the origin or a directly proportional situation.
The equation for this situation is |y=\color{red}{0.13}x.|
Ginette removes the plug from her bathtub, then she observes the water level in the bath every 2 minutes. The following is the data she collects.
|
Elapsed time (min) |
|2| |
|4| |
|6| |
|8| |
|---|---|---|---|---|
|
Water level (cm) |
|30| |
|22| |
|14| |
|6| |
-
How quickly does the water level in the tub drop? (rate of change)
-
What was the water level in the bath when Ginette removed the plug? (|y|-intercept or initial value)
-
Identify the dependent and independent variables
|x=| Elapsed time (min)
|y=| Water level (cm) -
Choose two points from the table of values
1st point: Water level of 30 cm after 2 minutes |= \underset{\color{navy}{\large{(x_1 ,\ y_1)}}}{\color{navy}{(2\ , 30)}}|
2nd point: Water level of 6 cm after 8 minutes |= \underset{\color{green}{\large{(x_2,\ y_2)}}}{\color{green}{(8 , 6)}}|
-
Apply the rate of change formula ||\begin{align}\color{red}{a}=\dfrac{\Delta y}{\Delta x}&= \dfrac{\color{green}{y_2}-\color{navy}{y_1}}{\color{green}{x_2}-\color{navy}{x_1}}\\&=\dfrac{\color{green}{6}-\color{navy}{30}}{\color{green}{8}-\color{navy}{2}} \\ &= \dfrac{-24}{6} \\ &= \color{red}{-4} \end{align}||In this situation, the rate of change is the rate at which the water level decreases, since |\color{red}{a}| is negative. Thus, the water level drops by |4\ \text{cm}| per minute.
-
Replace |\color{red}{a}| by |\color{red}{-4}| and |x| and |y| by the coordinates of a point, then isolate |\color{blue}{b}|
Here, we choose the pair |(x,y) = (6,14).| ||\begin{align} y &= \color{red}{a}x+\color{blue}{b} \\ y &= \color{red}{-4}x+\color{blue}{b} \\ 14 &= -4(6) +\color{blue}{b} \\ 14 &= -24+\color{blue}{b} \\ 14 \color{red}{+24} &= -24 \color{red}{+24} +\color{blue}{b} \\ \color{blue}{38} &= \color{blue}{b} \end{align}||The |y|-intercept is |\color{blue}{38}\ \text{cm}.| This is the water level in the bathtub before Ginette removed the plug, i.e. at |0| minutes.
Since the initial value is different from |0,| it is a linear function of partial variation.
The equation for this example is |y=\color{red}{-4}x+\color{blue}{38}.|
In a word problem, it often happens that the rate of change and the initial value (|y|-intercept) are given directly. In this case, these values can be determined without having to perform any calculations.
At the start of his last trip, Justin's car had |125\ 000| km on the odometer. He maintained an average speed of |100| km/h during the trip. What will be the total mileage on his car after driving for |22| hours?
In this problem, the rate of change and the |y|-intercept are given directly. Calculating them is not necessary.
Since a speed is a rate, the average speed is the rate of change. So, |\color{red}{a=100}| km/h.
The initial value (|y|-intercept) corresponds to the value at the start of an experiment or a situation. Here, the initial value is given directly — the mileage at the very start of the trip. So, |\color{blue}{b= 125\ 000}| km.
The equation representing the situation is |y=\color{red}{100}x + \color{blue}{125\ 000},| where |x| is the number of hours spent driving beginning from the start of the trip and |y| is the total odometer reading (km).
Therefore, to answer the question, replace |x| with |22| and then calculate to find the value of |y|.
If the price of gasoline was |\$ 1.12\text{/L}| when I went to get gas, how many litres did I put in my car's fuel tank if I paid |\$ 56?|
Since the price of gasoline is expressed as a rate, it is the rate of change in this situation. So, |\color{red}{a=\$ 1.12} \text{/L}.|
The initial value (|y|-intercept) is not given explicitly in the problem, but we can still deduce it if we correctly identify the type of situation. The cost of gasoline is a direct variation function, also called a directly proportional relationship. Drawing the graph of such a situation would result in a line that begins at the point |(0,0).| In other words, the initial value is zero. When |0| litres of gasoline have been added, nothing is paid! There is no initial price in such a situation. So, |\color{blue}{b=0}.|
Therefore, the equation is |y=\color{red}{1.12}x,| where |x| is the number of litres of gasoline purchased and |y| is the total cost of the transaction in |$.|
Therefore, to answer the question, replace |y| with |56| and then isolate |x|.
In other word problems, it is necessary to use coordinate pairs and calculate the rate of change using them. Then, the initial value (|y|-intercept) is calculated after substituting |a,| |x,| and |y| into the equation of a linear function. In other words, follow the same procedure as when the graph of the situation is available.
Rudolph went camping. He wakes up at 7:00 a.m. and notices that the temperature inside his tent is 15ºC. At 11:00 a.m., he notices that the temperature inside his tent is 21ºC.
-
How many degrees on average did the temperature inside his tent rise per hour during the morning?
-
What is the initial value (|y|-intercept) and what does it represent in this situation?
-
Identify the dependent and independent variables
|x=| Number of hours
|y=| Temperature (°C) -
Find two points from the text
At 7:00 a.m., the temperature is 15 ºC: |(7, 15)|
At 11 a.m., the temperature is 21 ºC: |(11, 21)| -
Apply the rate of change formula||\begin{align} \color{red}{a} = \frac{\Delta x}{\Delta y} &= \frac{y_2 - y_1}{x_2 - x_1} \\ &= \frac{21-15}{11-7} \\ &= \frac{6}{4} \\ &= \color{red}{1.5}\ ^{\circ}\text{C} / \text{h} \end{align}||The rate of change is |\color{red}{1.5}\ ^{\circ}\text{C} / \text{h}.|
-
Replace |\color{red}{a}| by |\color{red}{1.5}| and|\color{green}{x}| and |\color{green}{y}| by the coordinates of a point, then isolate |\color{blue}{b}|||\begin{align} y &= \color{red}{a}x + \color{blue}{b} \\ \color{green}{y} &= \color{red}{1.5}\color{green}{x} + \color{blue}{b} \\ \color{green}{15} &= 1.5(\color{green}{7}) + \color{blue}{b} \\ 15 &= 10.5 + \color{blue}{b} \\ 15\color{magenta}{-10.5} &= 10.5 \color{magenta}{-10.5} + \color{blue}{b} \\ \color{blue}{4.5} &= \color{blue}{b} \end{align}||The initial value (|y|-intercept) is |\color{blue}{4.5}\ ^{\circ}\text{C}.| This value corresponds to the temperature measured at |0\ \text{hours}| (midnight) if the temperature followed the same constant trend at that time.
The equation is |y=\color{red}{1.5}x+\color{blue}{4.5}.|
A 100-litre water tank empties at a constant rate in 8 minutes.
Represent the situation on a graph, then give the rate of change, the initial value, and the equation representing the situation.
-
Identify the dependent and independent variables
|x=| Time passed (min)
|y=| Quantity of water (L) -
Select 2 points on the line
To select the 2 points, first draw the graph to visualize the situation.
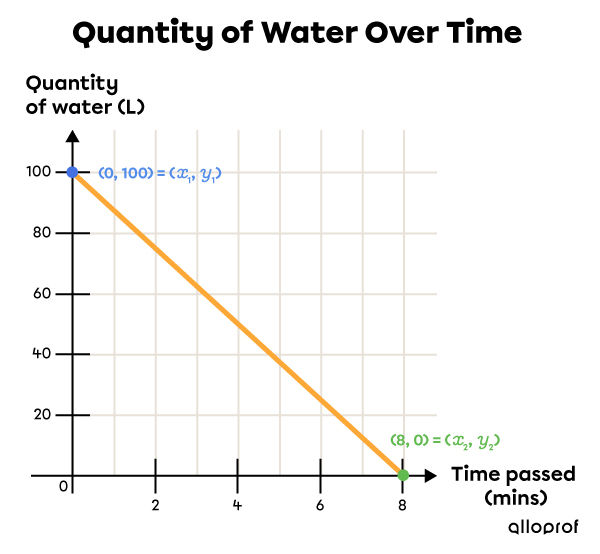
Since the tank contains |100\ \text{L}| of water initially, at |0| minutes, one point is |(0, 100).| This point is the |y|-intercept (the initial value).
Since it takes |8| minutes to empty the tank entirely |(\text{empty}=0\ \text{L}),| another point is |(8,0).| This point is the |x|-intercept, i.e. the point on the line located on the |x|-axis.
-
Apply the rate of change formula ||\begin{align} \color{red}{a} = \dfrac{\Delta y}{\Delta x} &= \dfrac{\color{green}{y_2} - \color{blue}{y_1}}{\color{green}{x_2} - \color{blue}{x_1}} \\ &= \dfrac{\color{green}{0} - \color{blue}{100}}{\color{green}{8} - \color{blue}{0}} \\ &= \dfrac{-100}{8} \\ &= \color{red}{-12.5}\ \text{L/min} \end{align}||The rate of change is |\color{red}{-12.5}\ \text{L/min}.| It is negative, which is normal, since the tank is being emptied.
-
Replace |\color{red}{a}| by |\color{red}{-12.5}| and |x| and |y| by the coordinates of a point, and then isolate |\color{blue}{b}|
The |y|-intercept (initial value) was given directly in the problem. It is the initial amount of water in the tank, i.e. |\color{blue}{100}\ \text{L}.| Therefore, it is not necessary to do step 4.
The equation is |y=\color{red}{-12{.}5}x + \color{blue}{100}.|