The Venn diagram is a visual representation of 2 or more subsets of a sample set. A point located inside a closed curve indicates that it belongs to the set in question.
The Venn diagram can be used to represent sets of numbers, such as integers, even numbers, multiples of 5, etc. It can also be used to represent certain characteristics of a population, such as hair colour, sex, etc.
We can list all the elements of the sample set in the different represented sets of a Venn diagram. However, in some cases, we can simply list the number of elements (or the percentage of elements) that belong to each set.
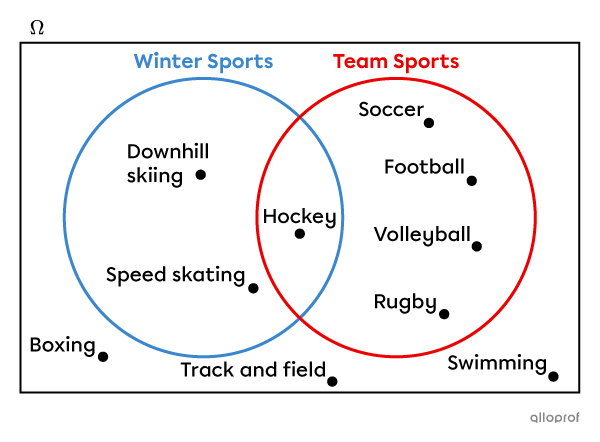
Using a Venn diagram, we want to sort the following list of sports into 2 major categories: winter sports and team sports.
-
Hockey
-
Soccer
-
Football
-
Boxing
-
Volleyball
-
Downhill skiing
-
Speed skating
-
Track and field
-
Swimming
-
Rugby
If we record all the sports from the list in the diagram, we get the following result.
If we only enter the number of sports in each part of the diagram, we get this result instead.
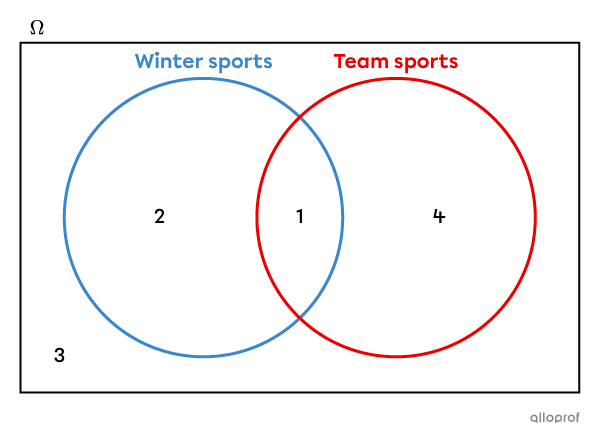
When the number of elements is very large or when the complete list of elements to be classified is not available, the 2nd type of diagram, where we simply enter the number of elements, is used.
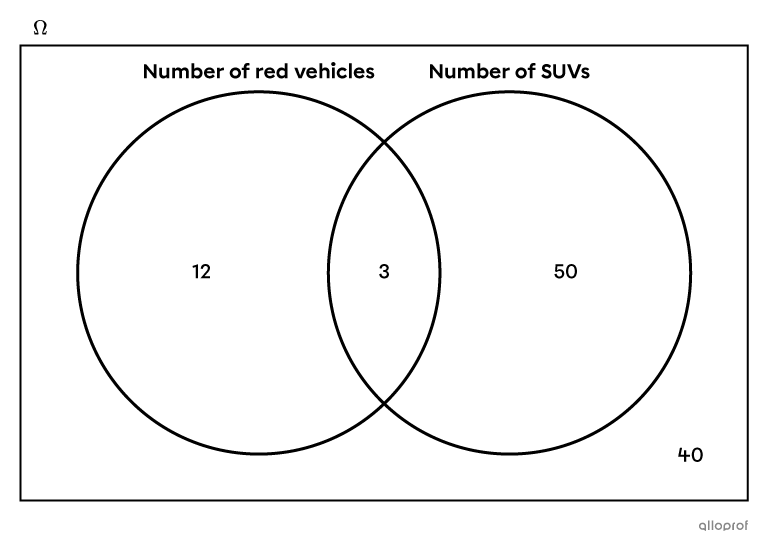
The following diagram shows that 40 of the 105 listed vehicles are neither an SUV nor a red vehicle. It is best to record the number of items found in each part of the diagram rather than recording each item one by one.
We use a Venn diagram to represent situations where we have 2 or 3 sets.
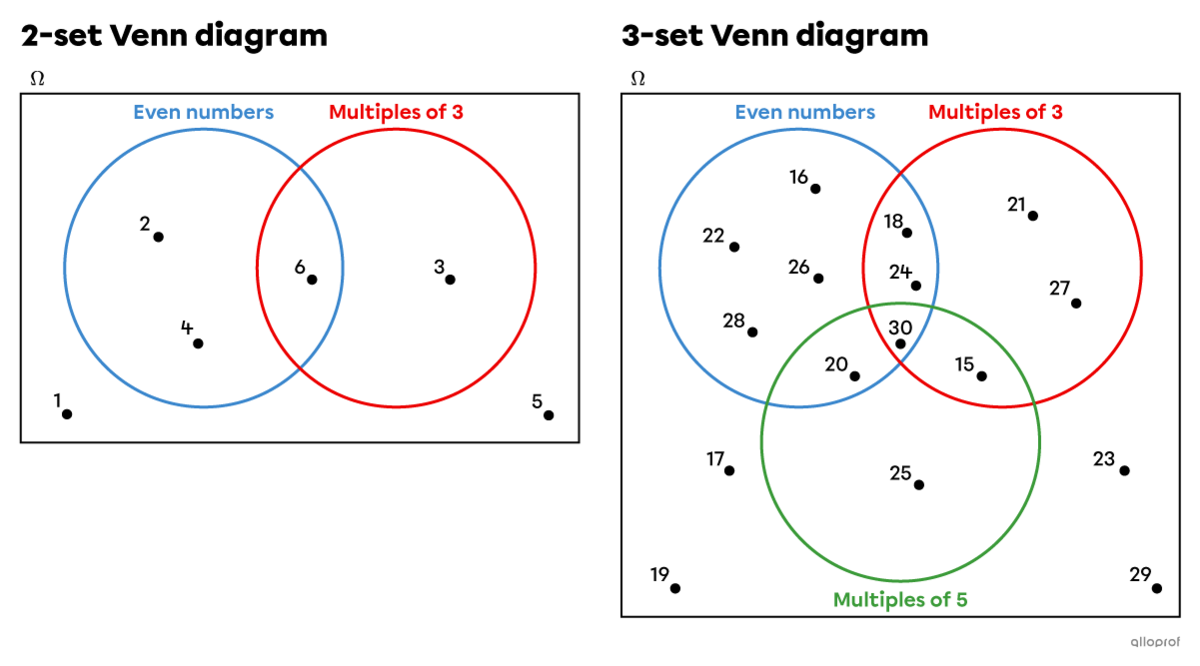
When there are more than 3 sets, it becomes very difficult to use a Venn diagram. It is preferable to use another mode of representation.
A 2-set Venn diagram is composed of 4 distinct zones: one zone shared by both sets, one zone that is exclusive to set A, one zone that is exclusive to set B and one zone that represents the remainder of the sample set.
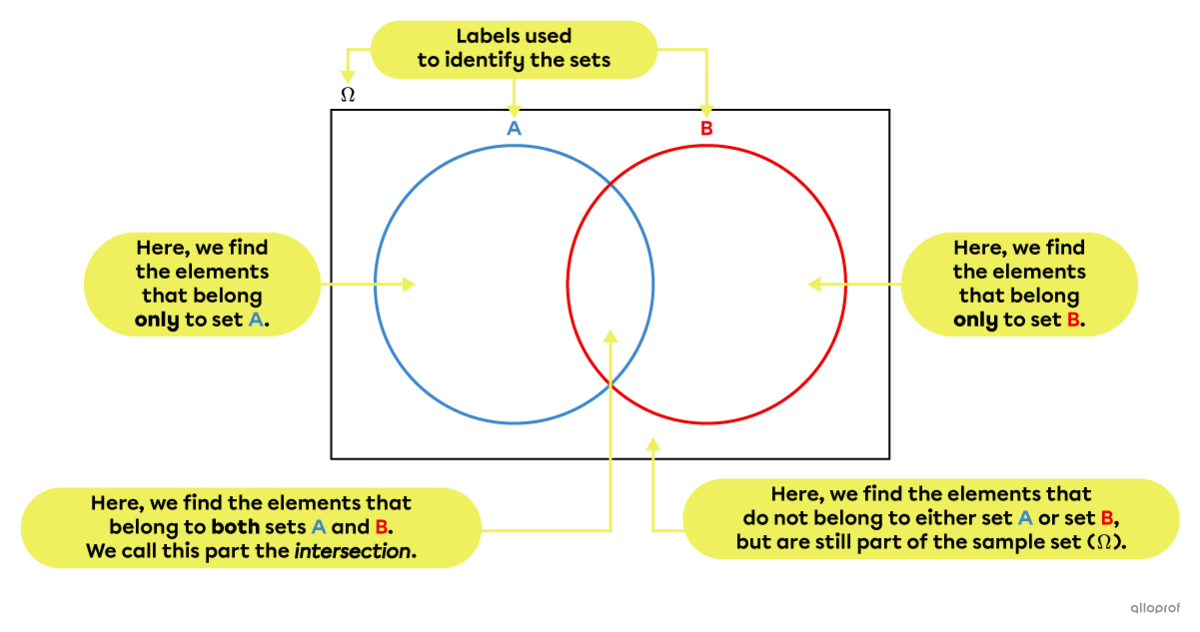
The intersection of A and B is the part that is common to both sets, while the union of A and B includes everything that belongs to either set A or set B, including the elements that belong to both A and B.
We often associate the notions of union and intersection with the concepts of "or" and "and" in probability.
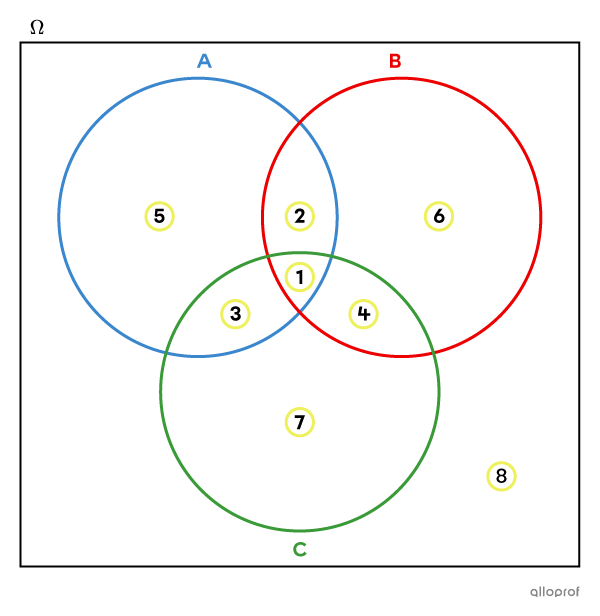
A 3-set Venn diagram is composed of 8 distinct zones.
-
Zone 1 is common to all 3 sets.
-
Zones 2, 3 and 4 are common to only 2 sets.
-
Zones 5, 6 and 7 are exclusive to one set.
-
Zone 8 is not included in sets A, B or C.
After surveying 24-year-old adults to know if they had a piercing or tattoo, the survey results were represented in the following Venn diagram.
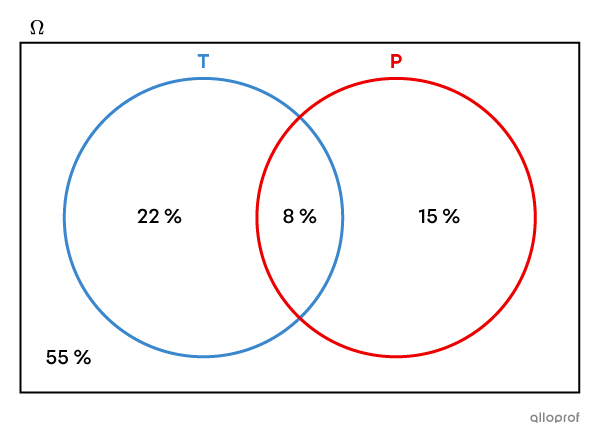
Set T represents young adults who have (at least) one tattoo.
Set P represents young adults who have (at least) one piercing (elsewhere than in the ears).
Here are the conclusions that can be drawn directly from the diagram.
-
|8\ \%| of young adults have a tattoo and a piercing.
-
|22\ \%| of young adults have a tattoo, but no piercing.
-
|15\ \%| of young adults have a piercing, but no tattoo.
-
|55\ \%| of young adults have no piercings or tattoos.
Here are additional conclusions that can be drawn using simple calculations.
-
|22\ \%+8\ \%=30\ \%| of young adults have a tattoo.
-
|15\ \%+8\ \%=23\ \%| of young adults have a piercing.
-
|22\ \%+8\ \%+15\ \%= 45\ \%| of young adults have a tattoo or a piercing (or both).
-
|55\ \%+15\ \%=70\ \%| of young adults do not have a tattoo.
-
|55\ \%+22\ \%=77\ \%| of young adults do not have a piercing.
When filling in a Venn diagram, it is very important to make sure that the sum of all the elements on the diagram corresponds to the number of elements in the sample set, not more or less. Therefore, you have to pay special attention to the expressions you use, such as "an element belongs to A," "an element belongs to A, but not to B," or "an element belongs only to A."
Here is a procedure that can help you fill in a Venn diagram:
-
Place the elements in the centre of the diagram, if possible, in the part common to all sets.
-
If possible, place elements that are not in any set.
-
Analyze each clue by first putting the elements that you are sure of, and then go back to the clues that were left out.
-
Ensure that all criteria are met, including the total number of elements in the sample set.
In group 304, there are 32 students, of which 12 wear glasses and 7 have braces, while 3 students have both braces and glasses.
Using a Venn diagram, determine how many students do not wear glasses and do not have braces.
We start by defining our sets.
|\Omega:| All students in group 304
A: Students wearing glasses
B: Students with braces
-
Place the common elements
We write |\color{#c58ae1}3| in the part that is common to both sets A and B. -
Complete each set
We know that |12| students wear glasses, but we have already placed |\color{#c58ae1}3| people in the intersection of sets A and B. So, to find out how many students with glasses there are left to place, we calculate |12-\color{#c58ae1}3,| which gives |\color{#3b87cd}9.| We therefore place |\color{#3b87cd}9| inside set A, but on the outside of set B.
We know that |7| students have braces, but we have already placed |\color{#c58ae1}3| people in the intersection of sets A and B. So, to know how many students are left to place in set B, we calculate |7-\color{#c58ae1}3,| which gives |\color{#ec0000}4.| So we place |\color{#ec0000}4| inside set B, but outside set A. -
Place elements that do not belong to any set
To find out how many students are left, we subtract the numbers already placed in the diagram |(\color{#3b87cd}9, \color{#c58ae1}3| and |\color{#ec0000}4)| from the total number of students in the class, |(32).|
||32-\color{#3b87cd}9-\color{#c58ae1}3-\color{#ec0000}4=\color{#3a9a38}{16}||
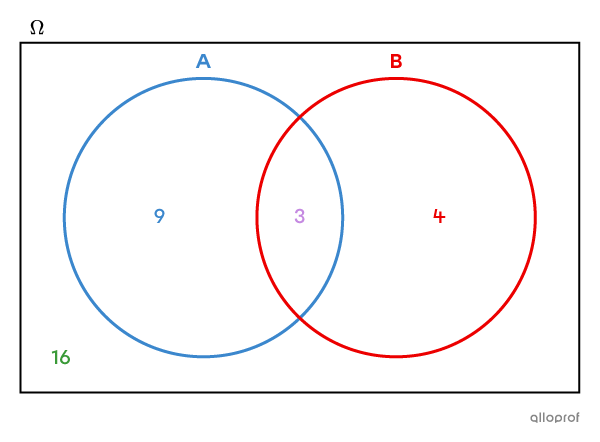
Answer: There are |\color{#3a9a38}{16}| students in group 304 who do not wear glasses and do not have braces.
A survey was conducted among the |164| Secondary 3 students at John Venn School to find out what condiments (ketchup, relish or mustard) they put on their hotdogs.
Here are the results:
-
|10| students did not add any condiments.
-
|25| students add only ketchup.
-
|27| students add relish and mustard.
-
|15| students use all 3 condiments.
-
|70| students use 2 condiments.
-
|80| students use relish.
-
|19| students use only ketchup and mustard.
Using a Venn diagram, determine how many students put mustard on their hotdogs.
We start by defining our sets.
|\Omega:| all John Venn Secondary 3 students
K: students who add ketchup on their hotdogs
R: students who add relish
M: students who add mustard
We analyze the clues one at a time.
-
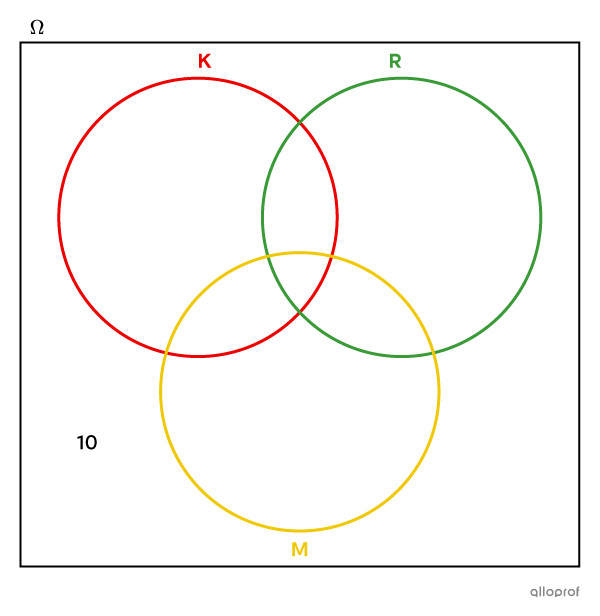
|10| students did not add any condiments.
This means that these |10| students are neither in set K, nor in set R, nor in set M. Therefore, we have to put |10| in the sample set, but outside the circles.
-
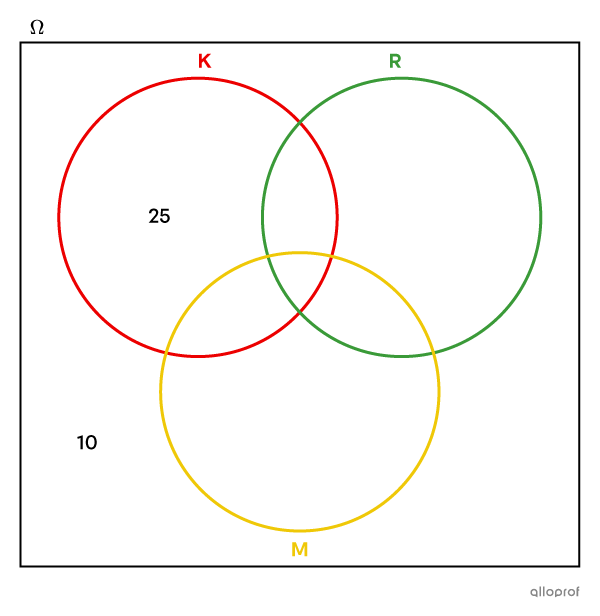
|25| students add only ketchup.
We therefore write |25| in the part of set K that is outside of sets R and M.
-
|27| students add relish and mustard.
Therefore, a total of |27| students are in the common part of sets R and M. However, this part of the diagram is itself divided into 2. Therefore, we need to analyze other clues before assigning these |27| students.
-
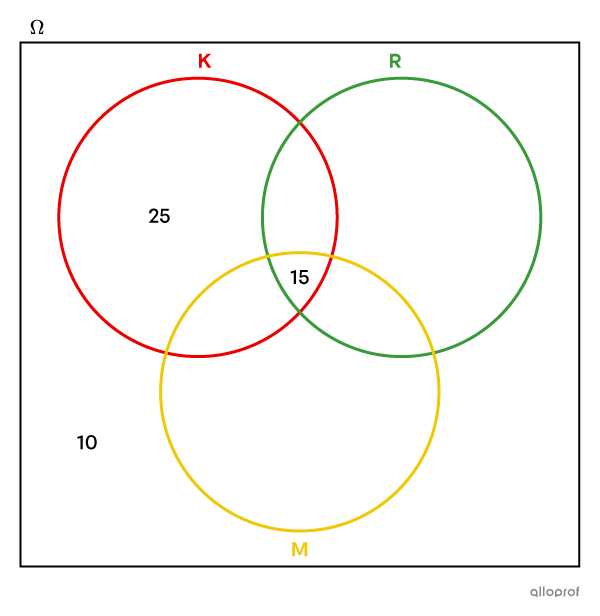
|15| students use all 3 condiments.
We therefore write |15| in the part that is common to all 3 circles.
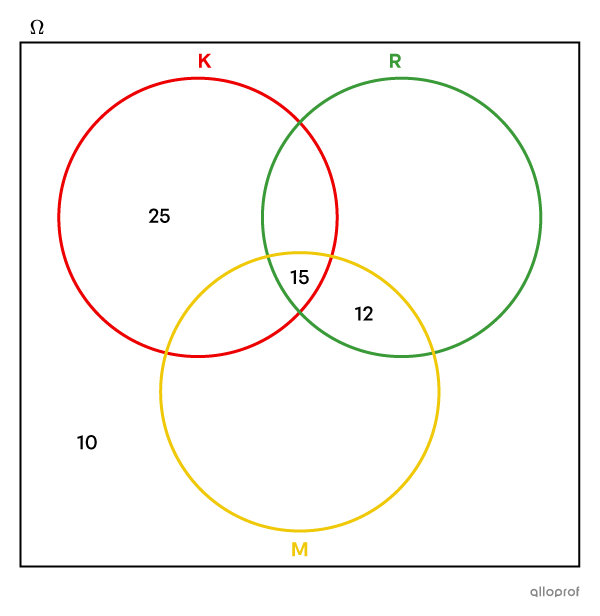
We return to the clue that we left out: |27| students put relish and mustard.
We must have a total of |27| in the common part of sets R and M. We have already placed |15|, so there are still |12| to be placed, since |27-15=12.|
-
|70| students use 2 condiments.
In other words, the sum of the 3 sections that are common to 2 sets must be |70.| We will leave this clue aside for the moment.
-
|80| students use relish.
We must also leave this clue aside for the moment, because there are still 2 parts of set R to fill in.
-
|19| students use only ketchup and mustard.
Therefore, we must place |19| in the common part of sets K and M, but outside of set R.

We return to the 1st clue left aside: |70| students use 2 condiments.
We find the number located in the common part of sets K and R, but outside set M by calculating |70-19-12=39.|
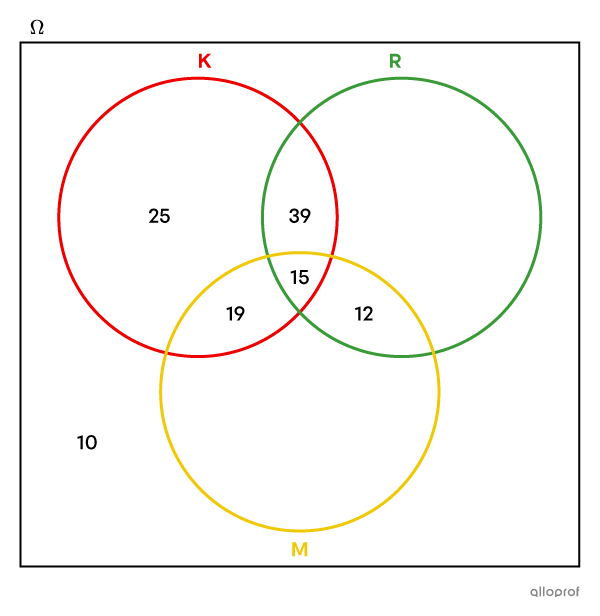
We return to the last clue that we left out: |80| students use relish.
We now find the number of students who use only relish by calculating |80-39-15-12=14.|
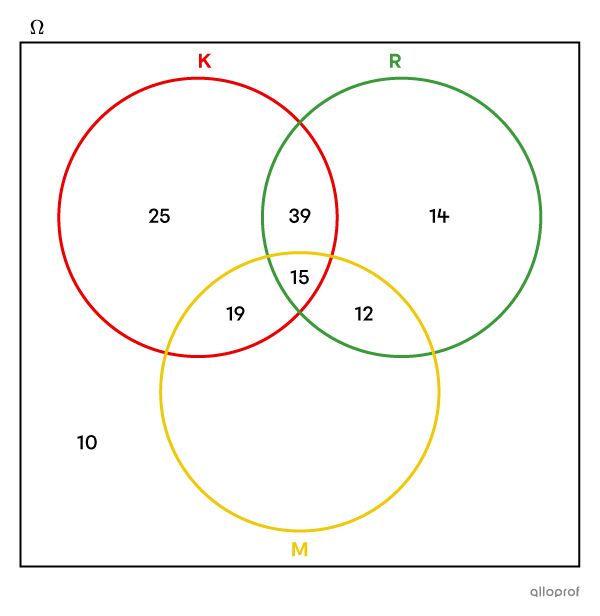
All but one section of the Venn diagram is completed. To finish the diagram, consider the total number of students surveyed: |164.| Therefore, to find the value to enter in the missing section, we subtract: ||164-25-39-14-10-19-15-12=30||

Now, we can answer the question. We know that |30| students add only mustard to their hotdogs, but if we want to know the total number of students who put mustard, we need to add the values from all sections that belong to set M. ||19+15+12+30=76||
Answer: |76| Secondary 3 students at John Venn School put mustard on their hotdogs.