The square root function is a branch of the inverse of the second-degree polynomial (quadratic) function. In other words, sketching a square root function is like sketching a horizontal half-parabola.
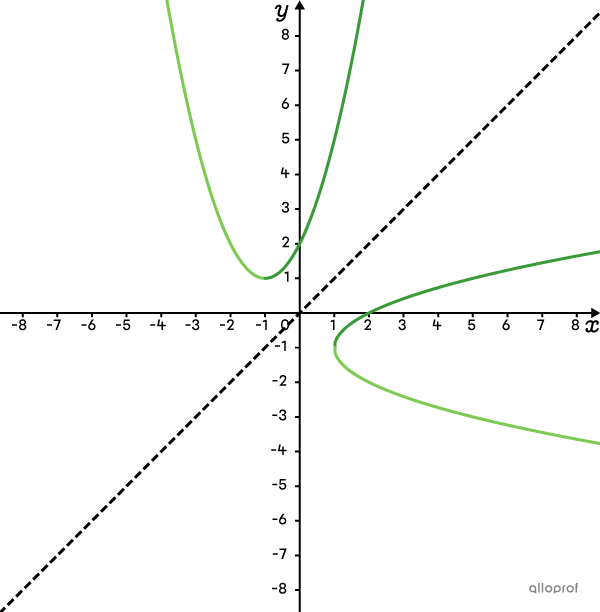
The table below indicates the shape of the curve according to the role of parameters |\color{#3B87CD}{a}| and |\color{#EC0000}{b}| of the square root function.
| |\color{#EC0000}{b}<0| | |\color{#EC0000}{b}>0| | |
|---|---|---|
| |\color{#3B87CD}{a}>0| |
The function is defined above and to the left of the vertex. 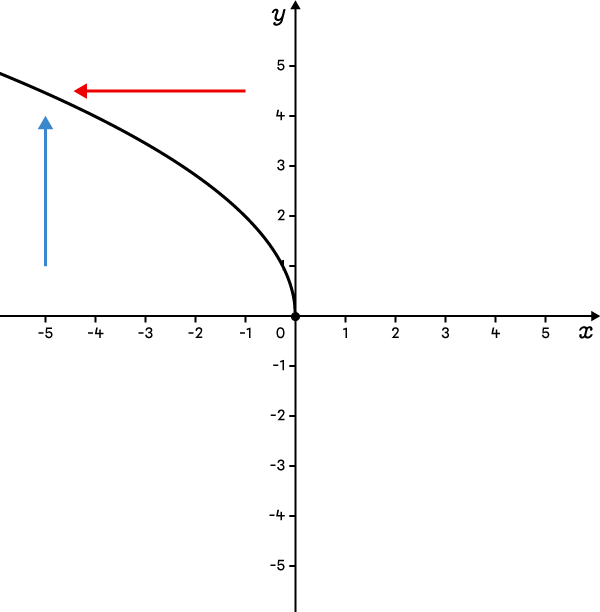 |
The function is defined above and to the right of the vertex. 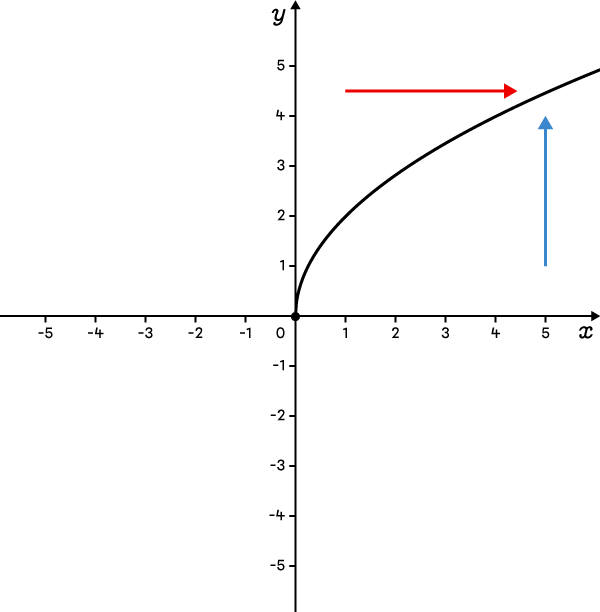 |
| |\color{#3B87CD}{a}<0| |
The function is defined below and to the left of the vertex. 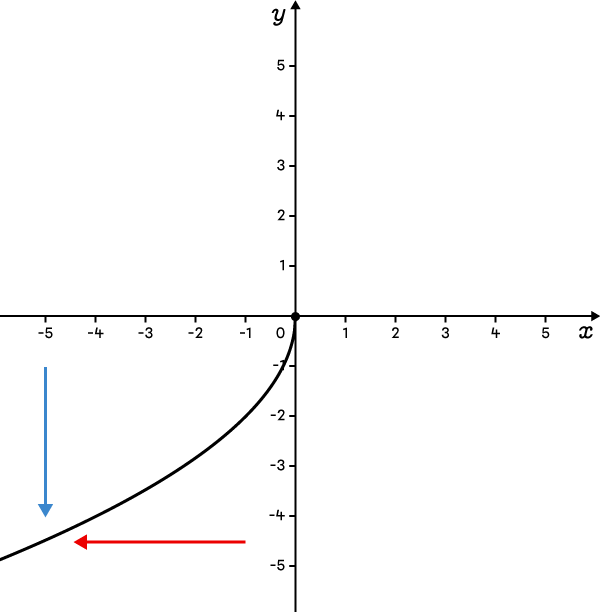 |
The function is defined below and to the right of the vertex. 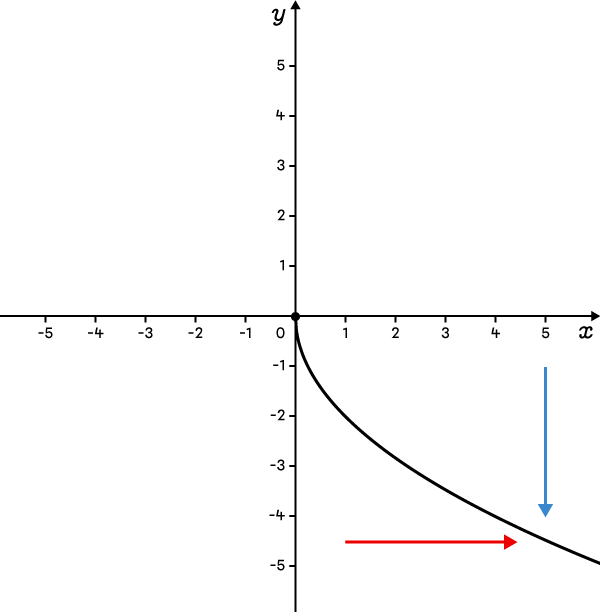 |
Use the following procedure to graph a square root function in the form of |f(x)=a\sqrt{bx}| on the Cartesian plane.
-
Place the vertex at the coordinates |(\color{#51B6C2}{0},\color{#FA7921}{0})| and determine the shape of the curve by analyzing parameters |\color{#3B87CD}{a}| and |\color{#EC0000}{b}.|
-
Calculate and plot additional points.
-
Graph the square root function.
Graph the function |f(x)=2\sqrt{-3x}.|
-
Place the vertex and determine the shape of the curve
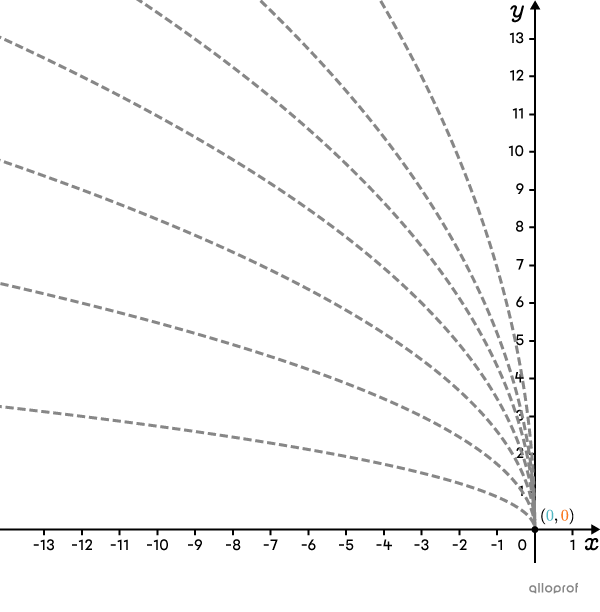
First, place a point at the origin of the Cartesian plane. Then, analyze parameters |\color{#3B87CD}{a}| and |\color{#EC0000}{b}.|
The parameter |\color{#3B87CD}{a}| equals |\color{#3B87CD}{2},| implying the curve is above the origin.
Parameter |\color{#EC0000}{b}| equals |\color{#EC0000}{-3},| so the curve is to the left of the origin.
-
Calculate and place additional points
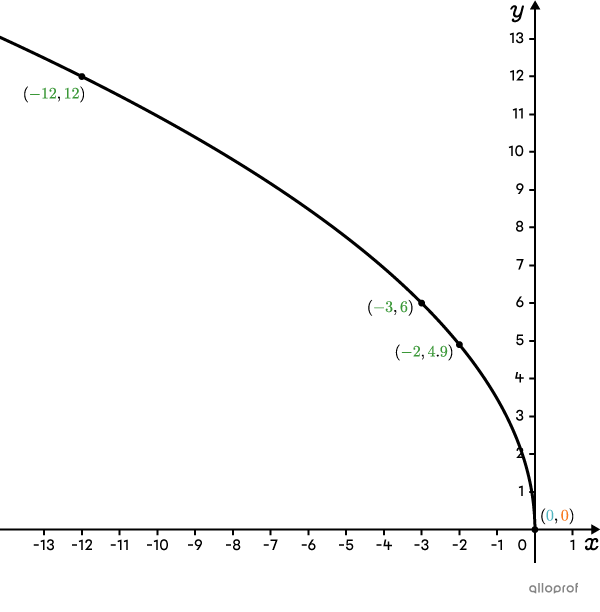
First choose random |\color{#3a9a38}{x}| values and calculate the corresponding |\color{#3a9a38}{f(x)}| values. Since the curve is to the left of the vertex, choose negative |\color{#3a9a38}{x}| values. First, taking |\color{#3a9a38}{x}=\color{#3a9a38}{-2}.| ||\begin{align}f(\color{#3a9a38}{x})&=2\sqrt{-3\color{#3a9a38}{x}}\\f(\color{#3a9a38}{-2})&=2\sqrt{-3(\color{#3a9a38}{-2}) }\\f(\color{#3a9a38}{-2})&=2\sqrt{6}\\\color{#3a9a38}{f(-2)}&\approx\color{#3a9a38}{4 .9}\\\end{align}||
The more points with known coordinates, the more precise the sketch of the curve. Therefore, |\color{#3a9a38}{x}=\color{#3a9a38}{-3}| and |\color{#3a9a38}{x}=\color{#3a9a38}{-12}| give the points |(-3,6)| and |(-12,12).|
Now, place the 3 points on the Cartesian plane.
Note that the 3 points are located to the left and above the origin, confirming what was determined in step 2.

-
Graph the function
Connecting all the points gives the curve of the function |f(x)=2\sqrt{-3x}.|
When choosing |x|-values to place additional points on the Cartesian plane, ensure the result under the root is a square number. It avoids approximating coordinates.
In the previous example, |x=-2| is not the best choice, because |-3\times-2=6.| Indeed, |6| is not a square number, because |\sqrt{6}\approx245.| However, |x=-3| and |x=-12| result in |9| and |36| respectively, two square numbers under the root.
Use the following procedure to sketch a square root function in the form of |f(x)=a\sqrt{b(x-h)}+k| on the Cartesian plane.
-
Place the vertex at the coordinates |(\color{#51B6C2}{h},\color{#FA7921}{k})| and analyze parameters |\color{#3B87CD}{a}| and |\color{#EC0000}{b}| to determine the shape of the curve.
-
Calculate and plot additional points.
-
Graph the square root function.
In step 3, although it is not always possible, calculate the value of the zero (the |x|-intercept) and the |y|-intercept.
Graph the function |f(x)=-3\sqrt{x-2}+6.|
-
Place the vertex at coordinates |(h,k)| and analyze the parameters |a| and |b| to determine the curve’s shape
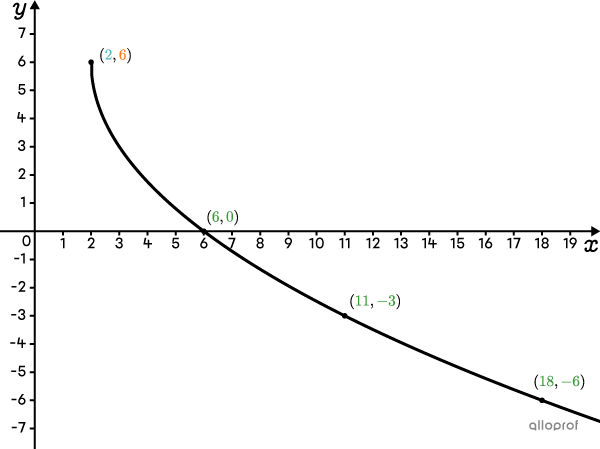
The function, |\color{#51b6c2}{h}=\color{#51b6c2}{2}| and |\color{#fa7921}{k}=\color{#fa7921}{6}.| So, place the vertex at |(\color{#51b6c2}{2},\color{#fa7921}{6}).|
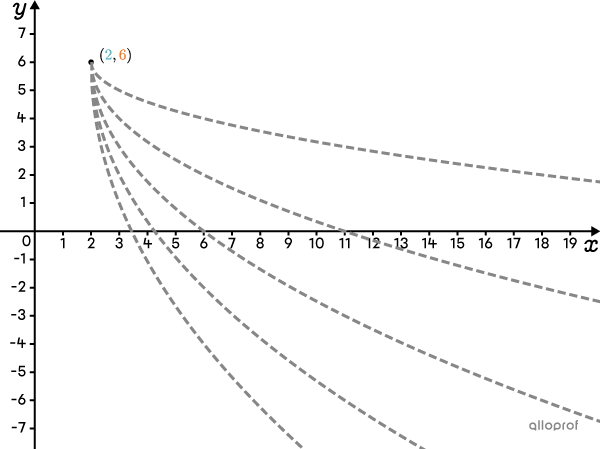
Parameter |\color{#3B87CD}{a}| equals |\color{#3B87CD}{-3},| meaning the curve is below the vertex.
Parameter |\color{#EC0000}{b}| equals |\color{#EC0000}{1},| so the curve is to the right of the vertex.
-
Calculate and place additional points
It can be determine from the previous image that all the potential curves cross the |x|-axis. It implies the function has an |x|-intercept. However, there is no |y|-intercept because none of the curves cross the |y|-axis. Now, replace |f(x)| with |0| to calculate the |x|-intercept. ||\begin{align}\color{#3a9a38}{f(x)}&=-3\sqrt{x-2}+6\\\color{#3a9a38 }{0}&=-3\sqrt{x-2}+6\\-6&=-3\sqrt{x-2}\\2&=\sqrt{x-2}\\4&=x-2\\6&=x\\\end{align}||
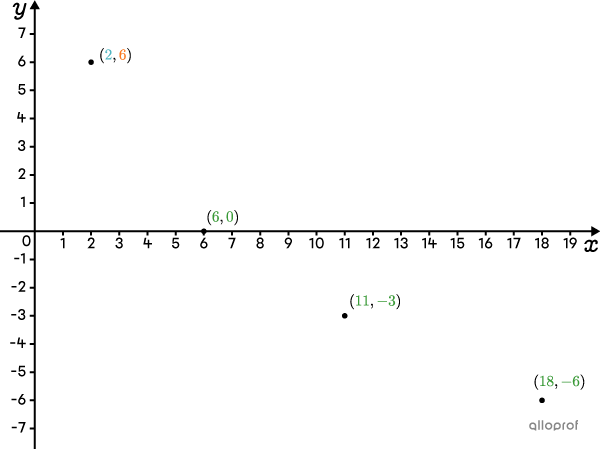
Therefore, the curve has a zero at |(6,0).| The function |f(x)=-3\sqrt{x-2}+6| does not have a |y|-intercept. Replacing |x| with |0| gives |\sqrt{-2},| which is not possible.
Now, calculate the coordinates of a few additional points to sketch a more precise function. Since the curve is to the right of the vertex, choose |x|-values greater than |2.| First, we can use |x=11.|
||\begin{align}f(\color{#3a9a38}{x})&=-3\sqrt{\color{#3a9a38}{x}-2}+ 6\\f(\color{#3a9a38}{11})&=-3\sqrt{\color{#3a9a38}{11}-2}+6\\f(11)&=-3\sqrt{9 }+6\\f(11)&=-3\times3+6\\\color{#3a9a38}{f(11)}&=\color{#3a9a38}{-3}\\\end{align}|| Similarly, with |x=18,| it gives another point with the coordinates |(18,-6).|
Place the |x|-intercept and the 2 points on the Cartesian plane.
Note that the 3 points are located to the right and below the vertex, confirming what was determined in step 2.
-
Graph the function
Connecting all the points, we obtain the graph of the function |f(x)=-3\sqrt{x-2}+6.|
