To graph the logarithmic function, construct a table of values by replacing |x| in the equation with various values and calculate the corresponding |y|-values. To do this, it's important to remember the logarithm laws.
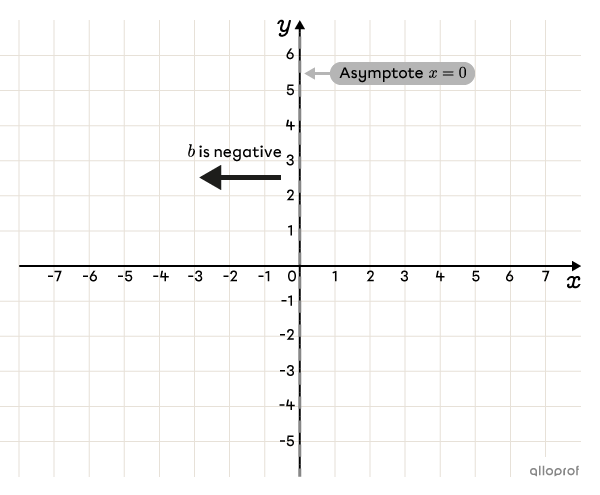
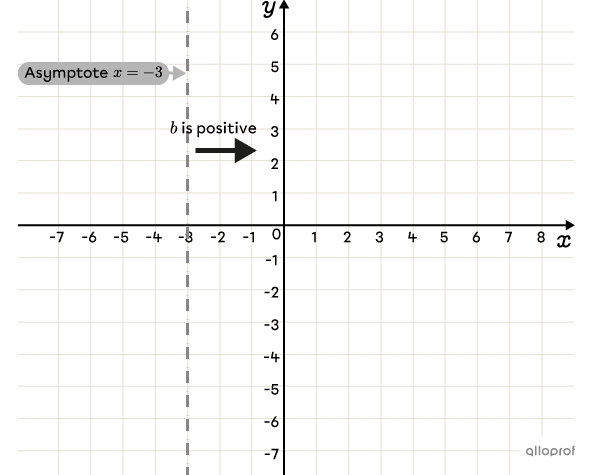
The logarithmic function has a vertical asymptote and its domain is restricted. The curve is located on the left or right side of the asymptote. The side that the curve is on can be determined by analyzing parameter |b.|
-
If parameter |b| is positive, the curve lies on the right side of the asymptote.
-
If parameter |b| is negative, the curve lies on the left side of the asymptote.
There are two main forms for writing the rule of a logarithmic function.
The natural logarithm, |(\ln x),| is graphed in the same way as all other logarithms, except its base is |e.|
|\ln x=\log_ex|
where
|e\approx 2.718|
The logarithmic function in the form |f(x)=a\log_c(bx)| has a vertical asymptote at |x=0.| Follow these steps to graph it.
-
Graph the vertical asymptote at |x=0.|
-
Determine which side of the asymptote the curve lies on by analyzing parameter |b.|
-
Construct a table of values.
-
Plot the points found in step 3 on the Cartesian plane and draw the curve.
When graphing the logarithmic function, the curve must get closer and closer to the asymptote without ever touching it.
Graph the logarithmic function with the rule |f(x)=-2\log_{3}\left(-\dfrac{x}{2}\right).|
-
Graph the vertical asymptote |\boldsymbol{x=0}|
-
Determine which side of the asymptote the curve lies on by analyzing parameter |b|
|b=-\dfrac{1}{2}.| Since |b| is negative, the curve lies to the left of the asymptote.
||x<0||

-
Construct a table of values
Since the curve lies to the left of the asymptote, we choose negative values for |x.|
We use |x=-1.|
||\begin{align}f(\color{#FA7921}x)&=-2\log_{3}\left(-\dfrac{\color{#FA7921}x}{2}\right)\\
f(\color{#FA7921}{-1})&=-2\log_{3}\left(-\dfrac{\color{#FA7921}{-1}}{2}\right)\\
f(-1)&=-2\log_{3}\left(\dfrac{1}{2}\right)
\end{align}||
Applying the change of base law for logarithms, we obtain the following.
||\begin{align}f(-1)&=-2\left(\dfrac{\log\left(\frac{1}{2}\right)}{\log(3)}\right)\\&\approx -2\left(\dfrac{-0.301}{0.477}\right)\\&\approx -2(-0.63)\\&\approx 1.26
\end{align}||
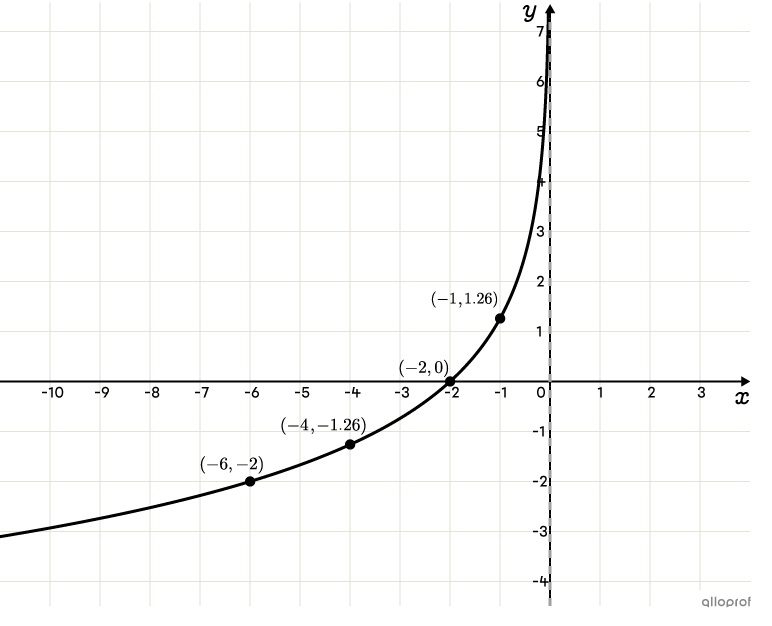
So, one point on the curve is |(-1,1.26).| Next, we repeat and find other coordinates with different |x|-values.
We use |x=-2.|
||\begin{align}f(\color{#FA7921}x)&=-2\log_{3}\left(-\dfrac{\color{#FA7921}x}{2}\right)\\
f(\color{#FA7921}{-2})&=-2\log_{3}\left(-\dfrac{\color{#FA7921}{-2}}{2}\right)\\
f(-2)&=-2\log_{3}(1)
\end{align}||
The logarithm of |1| is |0.|
||\begin{align}f(-2)&=-2(0)\\&=0\end{align}||
So, another point on the curve is |(-2,0).|
Continuing with the same method, the following table of values can be constructed.
| |x| | |-1| | |-2| | |-4| | |-6| |
|---|---|---|---|---|
| |y| | |1.26| | |0| | |-1.26| | |-2| |
-
Plot the points found in step 3 on the Cartesian plane and draw the curve

To make logarithm calculations easier and obtain integer coordinates, we select |x|-values so the argument of the logarithm is a power of the base.
In the previous example, the rule was |f(x)=-2\log_{3}\left(-\dfrac{x}{2}\right).| The base is |\color{#333fb1}3| and the argument is |\left(\color{#EC0000}{-\dfrac{x}{2}}\right).|
We determine the powers of |\color{#333fb1}3.|
||\color{#333fb1}3^\color{#3A9A38}0,\color{#333fb1}3^\color{#3A9A38}1,\color{#333fb1}3^\color{#3A9A38}2,\color{#333fb1}3^\color{#3A9A38}3,\color{#333fb1}3^\color{#3A9A38}4,\dots\\\color{#EC0000}1,\color{#EC0000}3,\color{#EC0000}9,\color{#EC0000}{27},\color{#EC0000}{81},\dots||
Then, we find the |x|-values that have these powers in the argument.
|\begin{align}\color{#ec0000}{-\dfrac{x}{2}}&=\color{#ec0000}1\\
x&=-2\end{align}|
When |x=-2,| the argument is |\color{#EC0000}1.|
||\log_{\color{#333fb1}3}(\color{#EC0000}{1})\\
\Downarrow\\
\color{#3A9A38}{0}||
|\begin{align}\color{#ec0000}{-\dfrac{x}{2}}&=\color{#ec0000}3\\
x&=-6\end{align}|
When |x=-6,| the argument is |\color{#EC0000}3.|
||\log_{\color{#333fb1}3}(\color{#EC0000}{3})\\
\Downarrow\\
\color{#3A9A38}{1}||
|\begin{align}\color{#ec0000}{-\dfrac{x}{2}}&=\color{#ec0000}9\\
x&=-18\end{align}|
When |x=-18,| the argument is |\color{#EC0000}9.|
||\log_{\color{#333fb1}3}(\color{#EC0000}{9})\\
\Downarrow\\
\color{#3A9A38}{2}||
So, by choosing |x=-2,| |x=-6,| and |x=-18,| there is no need to use the change of base law for logarithms to do the calculations. Also, we get coordinates that are integers.
To graph the logarithmic function in the form of |f(x)=a\log_c\big(b(x-h)\big)+k,| the steps are the same as for |f(x)=a\log_c(bx),| except the equation of the asymptote is |x=h.|
-
Graph the vertical asymptote at |x=h.|
-
Determine which side of the asymptote the curve lies on by analyzing parameter |b.|
-
Construct a table of values.
-
Plot the points found in step 3 on the Cartesian plane and draw the curve.
Graph the logarithmic function with the rule |f(x)=-\log_{2}(x+3)-4.|
-
Graph the vertical asymptote at |\boldsymbol{x=h}|
Since |h=-3,| the equation of the asymptote is |x=-3.| -
Determine which side of the asymptote the curve lies on by analyzing parameter |b|
From the equation, |b=1.| Since |b| is positive, the curve lies to the right of the asymptote.
||x>-3||

-
Construct a table of values
Since the curve lies to the right of the asymptote, we choose |x|-values that are greater than |-3.|We use |x=-2:.|
||\begin{align}f(\color{#FA7921}x)&=-\log_{2}(\color{#FA7921}x+3)-4\\
f(\color{#FA7921}{-2})&=-\log_{2}(\color{#FA7921}{-2}+3)-4\\
f(-2)&=-\log_{2}(1)-4
\end{align}||The logarithm of |1| is |0.|
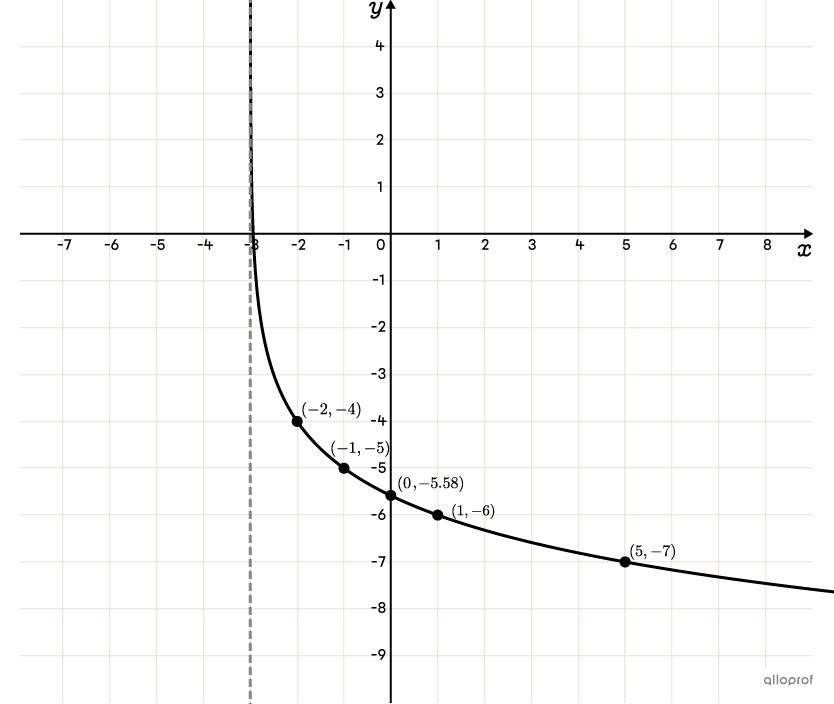
||\begin{align}f(-2)&=-(0)-4\\&=-4\end{align}||So, a point on the curve is |(-2,-4).| Next, we repeat and find other coordinates with different |x|-values.
We use |x=-1.|
||\begin{align}f(\color{#FA7921}x)&=-\log_{2}(\color{#FA7921}x+3)-4\\f(\color{#FA7921}{-1})&=-\log_{2}(\color{#FA7921}{-1}+3)-4\\f(-1)&=-\log_{2}(2)-4\\f(-1)&=-(1)-4\\f(-1)&=-5\end{align}||So, another point on the curve is |(-1,-5).| Continuing on, the |y|-intercept can be found.
We use |x=0.|
||\begin{align}f(\color{#FA7921}x)&=-\log_{2}(\color{#FA7921}x+3)-4\\
f(\color{#FA7921}{0})&=-\log_{2}(\color{#FA7921}{0}+3)-4\\
f(0)&=-\log_{2}(3)-4
\end{align}||Applying the change of base law for logarithms, we obtain the following.
||\begin{align}f(0)&=-\left(\dfrac{\log3}{\log2}\right)-4\\&\approx -(1.58)-4\\&\approx -5.58
\end{align}||So, the |y|-intercept is |-5.58.|
Using the tip from above, the following table of values can be constructed.
| |x| | |-2| | |-1| | |0| | |1| | |5| |
|---|---|---|---|---|---|
| |y| | |-4| | |-5| | |-5.58| | |-6| | |-7| |
-
Plot the points found in step 3 on the Cartesian plane and draw the curve

Une erreur s'est glissée dans cette vidéo.
À 7 min 16 s, la base du logarithme devrait être |3| plutôt que |\dfrac{1}{3}.|