A graph is a set of links connecting elements together.
Links are represented by lines called edges or by arcs.
The elements are represented by points called vertices. These elements can be places, people, tasks, etc.
In the graphic representation of a graph:
-
Vertices are usually identified by a lowercase letter, uppercase letter, number, or word.
-
Edges are usually named using the letters indicating its endpoints in any order.
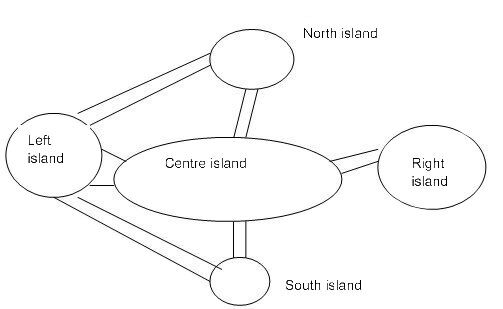
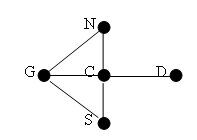
Here is an example of a graph reflecting a specific situation. The vertices represent islands and the edges represent bridges.
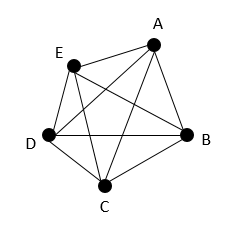
A complete graph is when each vertex is directly connected to all the other vertices.
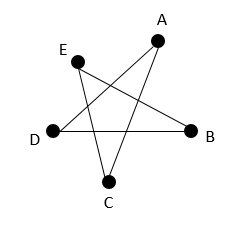
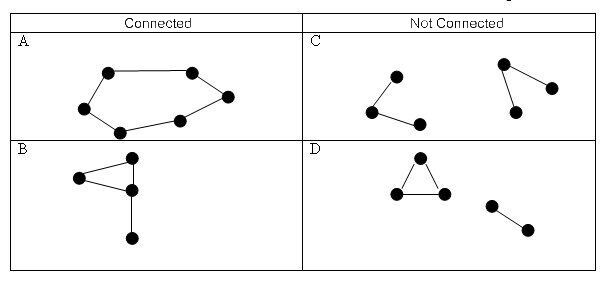
A graph is connected when any vertex can be connected to any other vertex by an edge or a series of edges. The connected graph is a one-piece graph.
The order of a graph corresponds to the number of vertices contained in a graph.
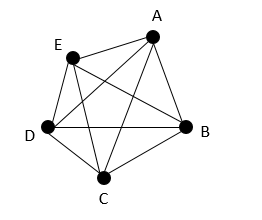
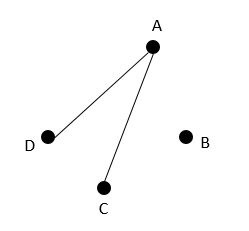
The number of times a vertex is touched by an edge is the degree of the vertex.
If more than one edge connects two vertices, the edges are parallel.
A loop is an edge connecting a vertex to itself. It counts as one edge, but for 2 degrees.
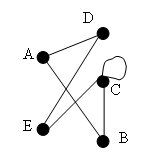
The degree of the vertex C = 4
The degree of the vertex B = 2
The degree of the vertex A = 2
The degree of the vertex E = 2
The degree of the vertex D = 2
The number of edges in the graph is 6.
The sum of the degrees of all vertices in a graph is always twice the number of edges in the graph. In the previous example, there are 6 edges and the sum of the degrees of all the vertices is 12.
Graphs are a useful way to represent certain situations. With a graph, it is possible to optimize or resolve situations which, at first glance, appear very complex. The following are some optimization methods using graphs.