This Crash Course focuses on scatter plots, correlation and regression lines. Its interactive videos (coming soon), Key Takeaways section and summary exercises will help you review these concepts.
To draw a scatter plot, you need to be able to plot points on a Cartesian plane. You must know how to associate a scatter plot with a mathematical model, which means within a family of functions. In particular, you need to be familiar with linear functions and the inverse variation function. Above all, you need to be able to find the rule of a linear function.
Lastly, since the methods for finding regression lines rely on the concepts of mean and medians, you should be able to determine these measures of central tendency within a data distribution.
A 2-variable distribution can be represented using a scatter plot. Next, we try to determine whether there is a link, or a correlation, between the 2 variables.
The correlation in question may be linear or nonlinear. The key is to find the mathematical model that best represents the scatter plot under study. This is called modelling.
When the scatter plot seems to form a particular curve, this trend curve can be modelled using various functions, including the inverse variation function.
When the scatter plot tends to form a straight line, it's called linear correlation and is modelled using a regression line, which is a linear function given by |(y=ax+b).|
The Linear Correlation Coefficient|\boldsymbol{(r)}|
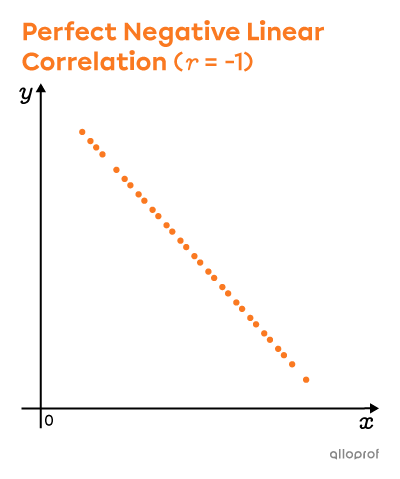
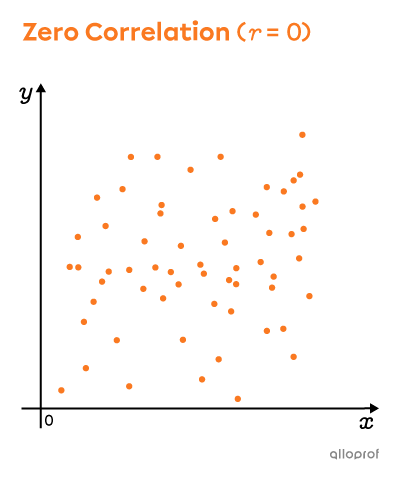
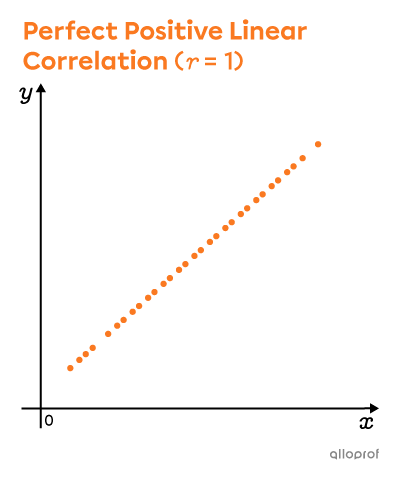
The strength of a distribution's correlation can be measured by calculating its linear correlation coefficient. The value of this coefficient varies between |-1| and |1.|
To calculate |r| precisely, we can use technological tools. For an approximate value, we can draw a rectangle around the scatter plot, measure the width and length of this rectangle, and then apply the following formula:||r\approx\pm\left(1-\dfrac{\text{small side}}{\text{big side}}\right)||
Methods for Finding the Rule of a Regression Line and Making Predictions
If the linear correlation between 2 variables is strong, then we can use the data to make predictions. To do this, we first need to find the rule of the regression line. There are several possible methods for doing this. Here are the steps involved for each of these methods.
The Graphing Method
-
Plot the points on a Cartesian plane.
-
Draw a regression line.
-
Identify 2 points on the regression line.
-
Find the rule of the line using these 2 points.
-
Predict a value using the rule of this line.
The Mayer Line Method
-
Order the coordinates according to the independent |(x)| variable.
-
Split the distribution into 2 equal groups, if possible.
-
Calculate the average points for each group: |(P_1| and |P_2).|
-
Find the rule of the regression line that passes through points |P_1| and |P_2.|
-
Predict values using the rule of the line.
The Median-Median Line Method
-
Order the coordinates according to the independent |(x)| variable.
-
Split the distribution into 3 equal groups, if possible.
-
Calculate the median points of each group: |(M_1,| |M_2| and |M3).|
-
Calculate the mean point |P,| whose coordinates are the average of the x and y coordinates of the median points.
-
Determine the rate of change |(a)| of the line that passes through |M_1| and |M_3.|
-
Determine the y-intercept |(b)| of the line that passes through |P| and whose rate of change is |a.|
-
Predict values using the rule of the line.
Making a prediction involves determining the value of one variable when the value of the other variable is known.
-
If the known value lies inside the interval represented by the scatter plot, it's called interpolation.
-
If the known value lies outside the interval represented by the scatter plot, it's called extrapolation.
The Reliability of Predictions and Methods
The stronger the correlation between 2 variables in a distribution |(\vert r\vert| is close to |1),| the more reliable the predictions will be, regardless of the method chosen.
Here are the factors that can affect the reliability of predictions:
-
The sample size is too small: This is because we can't be sure that our mathematical model is reliable on the basis of just a few pieces of data.
-
The distribution includes one or more outliers: Outlying data have a major influence on the calculation of the mean. For this reason, the median-median method is preferred when such data are observed.